Screenshots


How Much Does SkewTLogPro Make?
Platform Performance
Rating Distribution
Top Countries
Reviews (3)▼
I am a CFI who USED to use this app daily for summer flying & recommended it to all my colleagues and students. No more. Why? Well, while pricy to initially acquire, this app USED to be a one-time fee ($12 I believe). Then it inexplicably broke for the past year when the FAA/NOAA changed their data API, crashing when I tried to load the chart for any field. The developer provided no responses to my bug reports, despite my being an avid user and advocate. So. I gave up on this app and instead started using Windy’s skew-t generator, which is free. As this summer has rolled around, I noticed an update was FINALLY released. I excitedly downloaded it and — SURPRISE — the app been paywalled behind an annual subscription! No demo mode to verify that it actually works. No regard for the fact that I ALREADY paid to acquire it. Regrettably there are plenty of free Skew-T generators out there so I am removing this from my EFB and will no longer mention it to colleagues nor students. It’s been a nice run folks, sorry to see that this IP has been sucked up by a faceless corp who just want to extract an annuity from pilots and has no regard for prior purchases. To add insult to injury, the underlying data source (NOAA) is STILL paid for by US tax dollars. Shameful.
This app is a really good tool for telling you what to expect with regard to current weather, and can help you improve your own forecasting. Using this app and learning enough to be able to understand all it has to offer ought to be part of being a pilot. It's really fun to look out the window at any time of day, estimate the height of the clouds I see, and then get on SkewTLogPro and use the graph to see how close I estimated. The graphs always match the ceilings given by the 3 airports near here. And the app's charts are a whole lot easier to read than NOAA Skew-T charts.
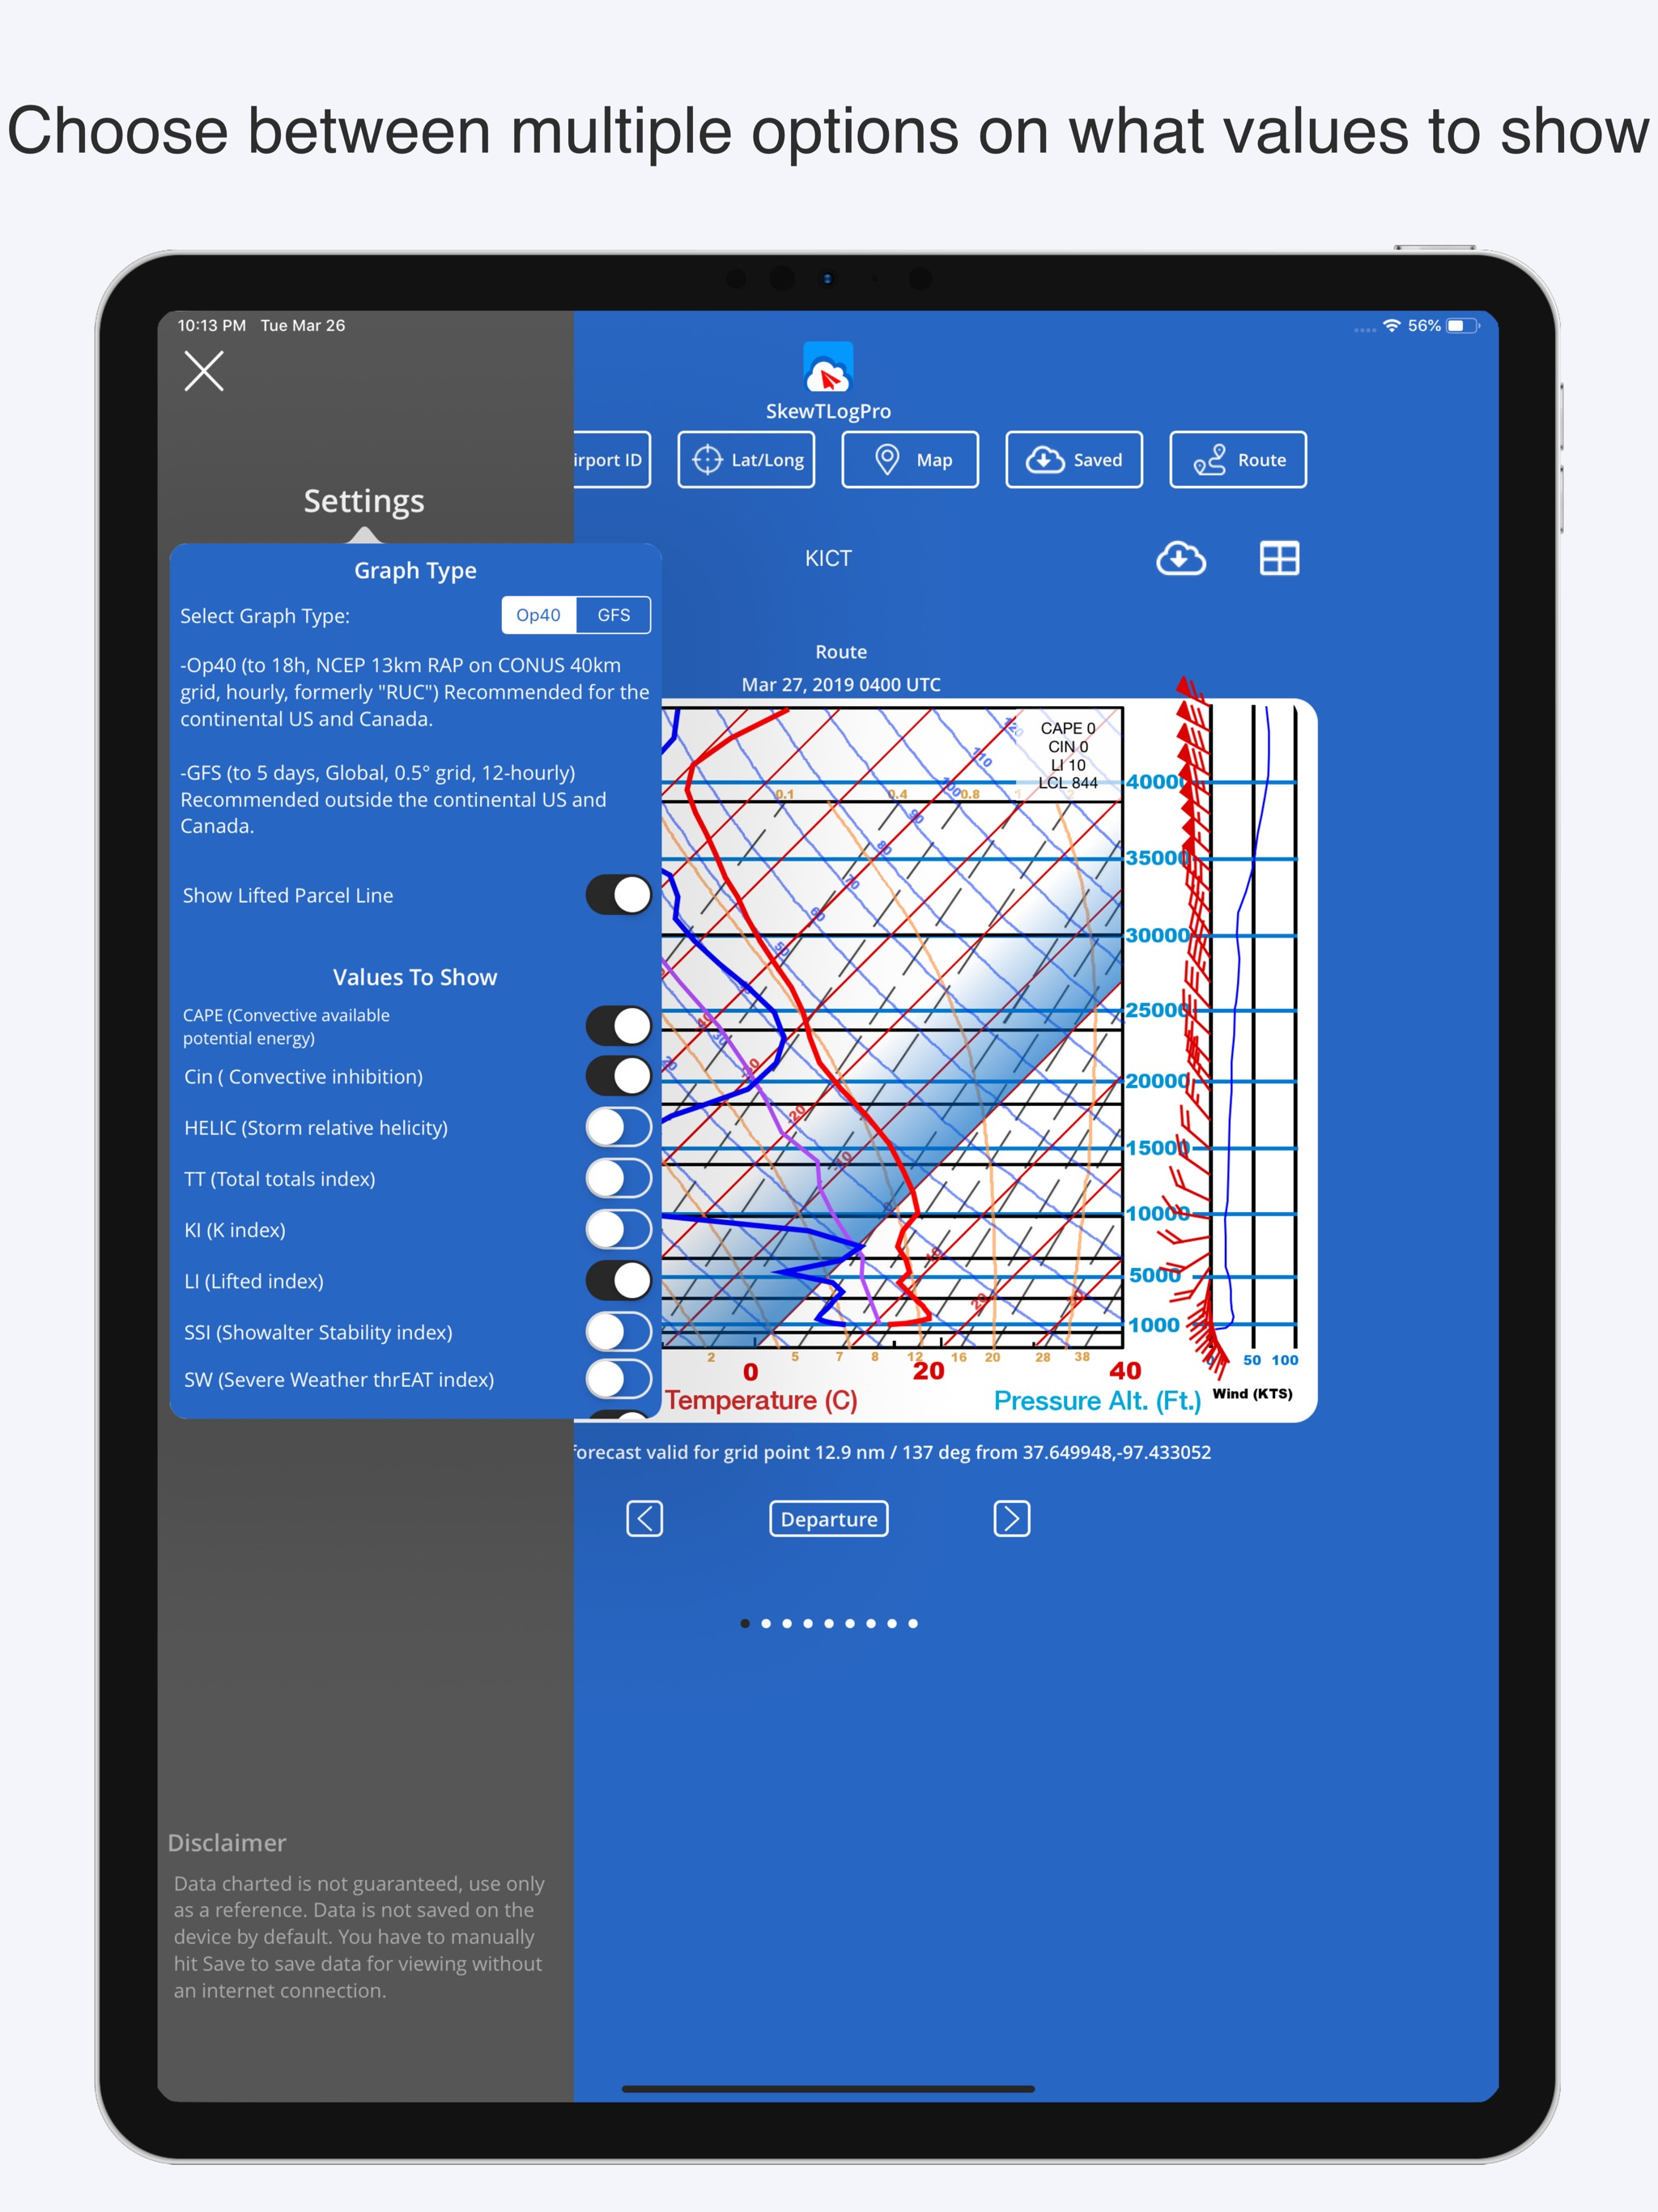
This app is a great concept, but for a pilot it falls short on much of why I use a skew chart in the first place. Namely on the visualization of items such as convective inhibition, LFC, CAPE, EL, etc. I mean it is a chart, so you would expect to easily view these items graphically on the chart itself. Instead you only see the numerical value on the side of the chart. If this app were to simply add a line showing the adiabatic temperature values of a lifted parcel of air, it would deserve a 5-star rating.
Version History (36)▼
Available In (115 Countries)▼
Supported Languages (1)▼
App Details▼
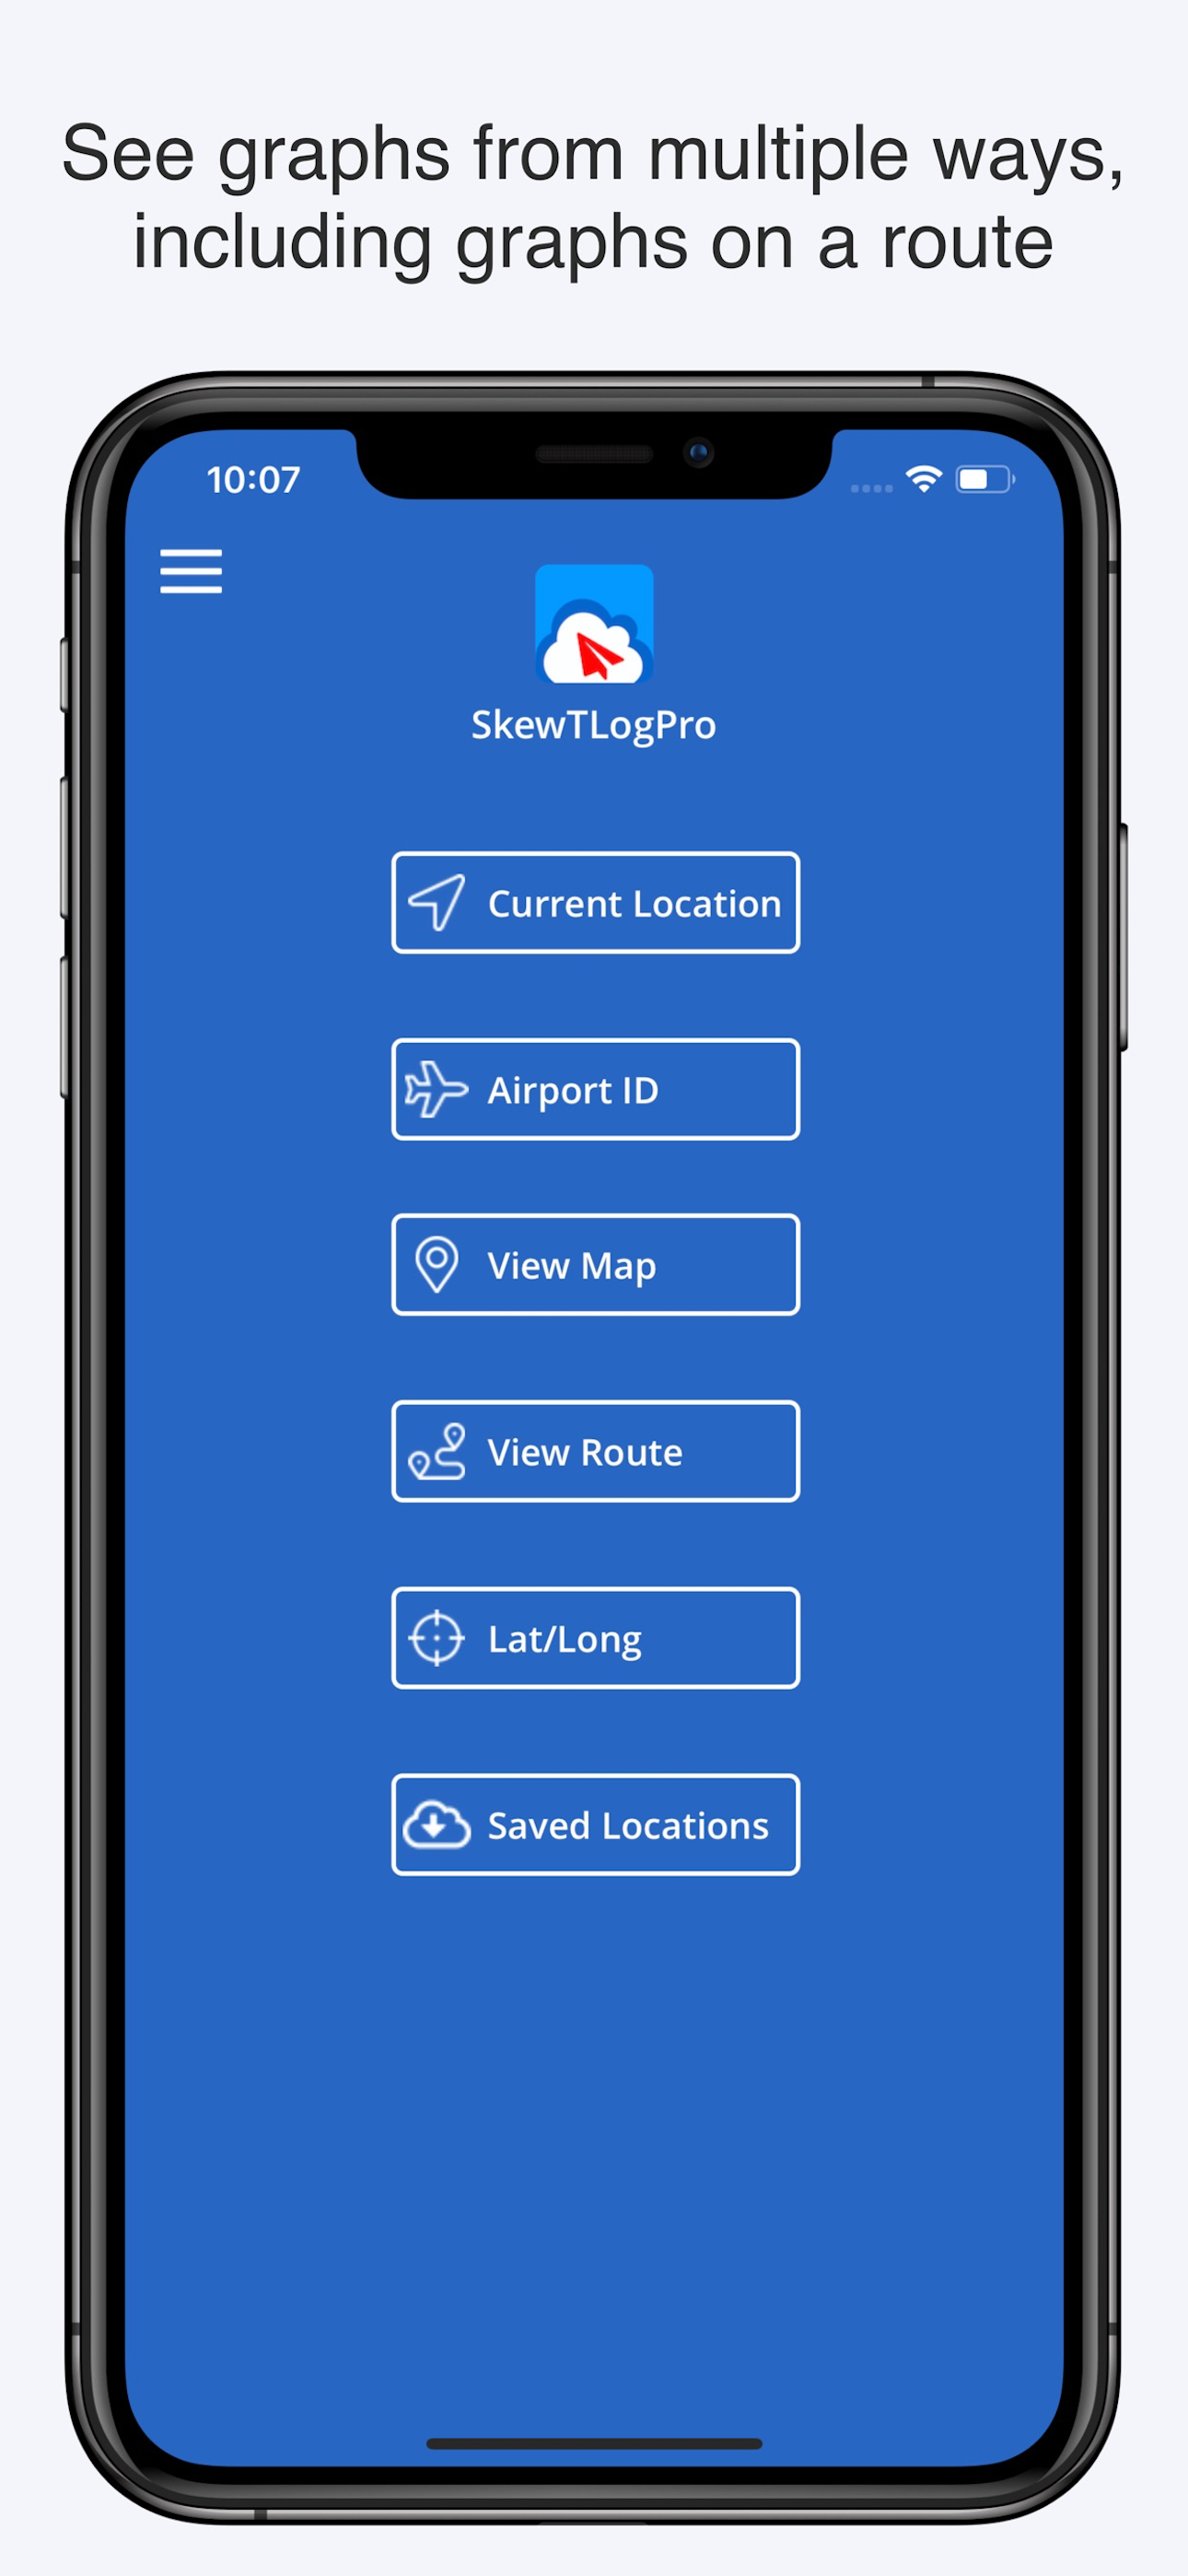
SkewTLogPro gives you one-touch access to powerful skew-t log-p charts. View charts using your current GPS location, airport ID code or lat/lon. Each...
In-App Purchases (1)
| Name | Price | Type |
|---|---|---|
| Annual Subscription | $12.99 | Yearly |
Similar Apps