
Check the acquisition promise
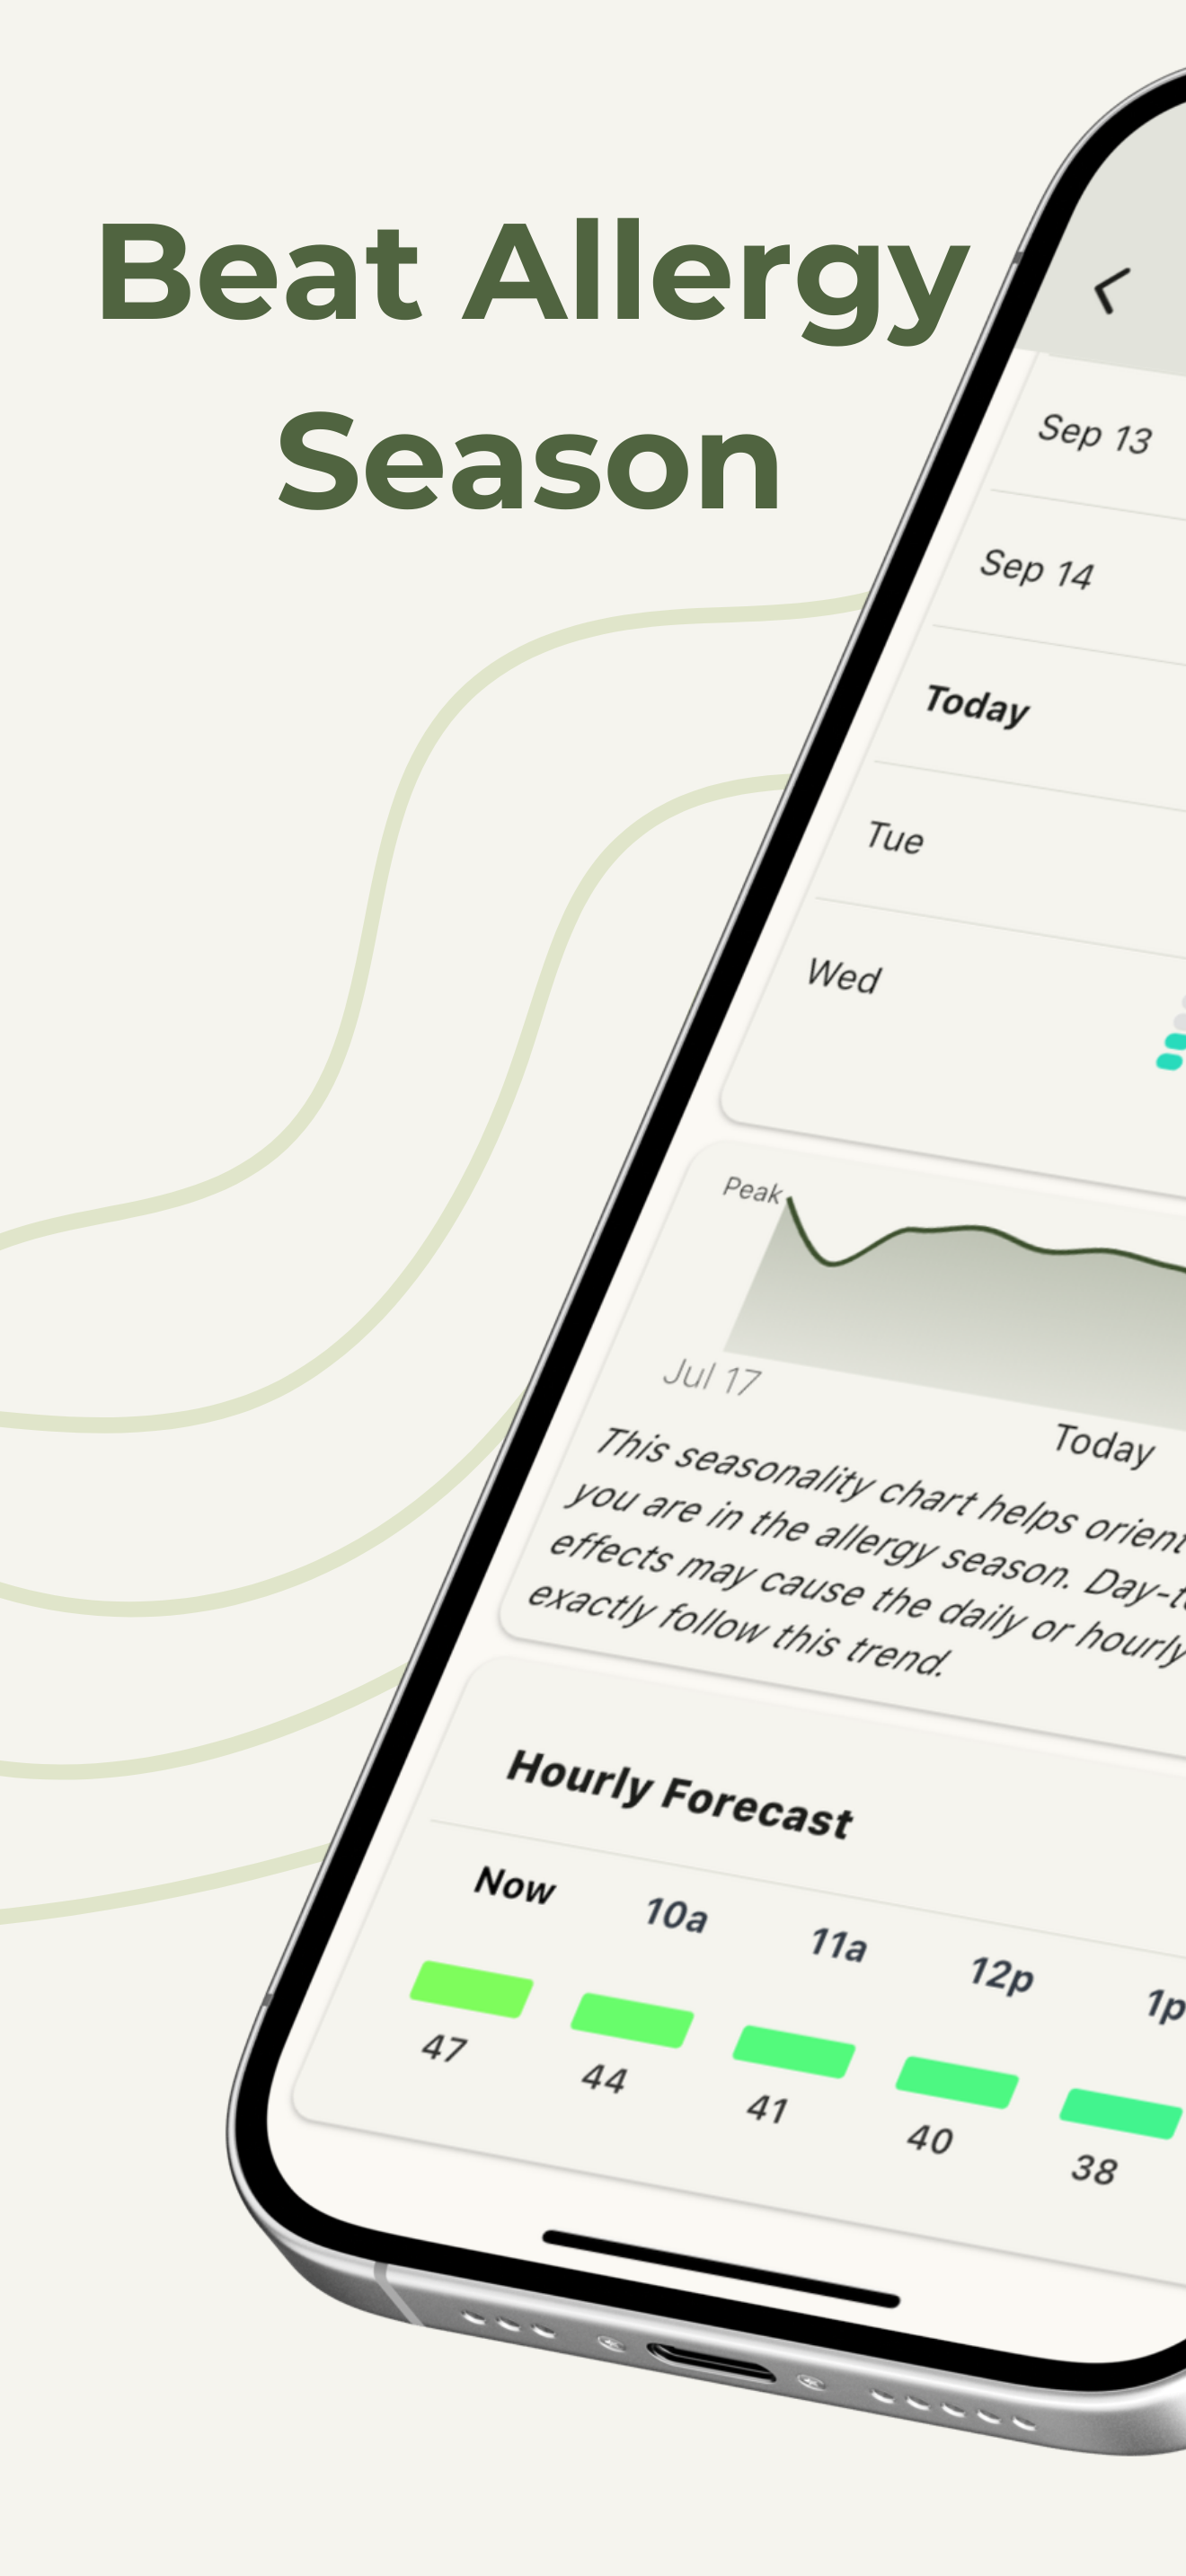
Read the store headline, screenshots and description. What problem is the app promising to solve?
Study the storefront ↗
Pollen Sense · iOS
Explore the ad evidence, study the storefront, and build your next acquisition hypothesis.
01 / Creative research
Read the store headline, screenshots and description. What problem is the app promising to solve?
Study the storefront ↗Explore apps with direct store-link matches. Compare their hooks and formats without assuming the same approach works here.
Browse observed advertisers ↗Store rankings and revenue estimates describe market context. They do not establish ad spend, conversions or ROAS.
Review the market context ↗02 / Storefront & product
Study the product story and store experience behind the acquisition funnel.



03 / Market context
Keep revenue, downloads and store rankings separate from advertising performance.
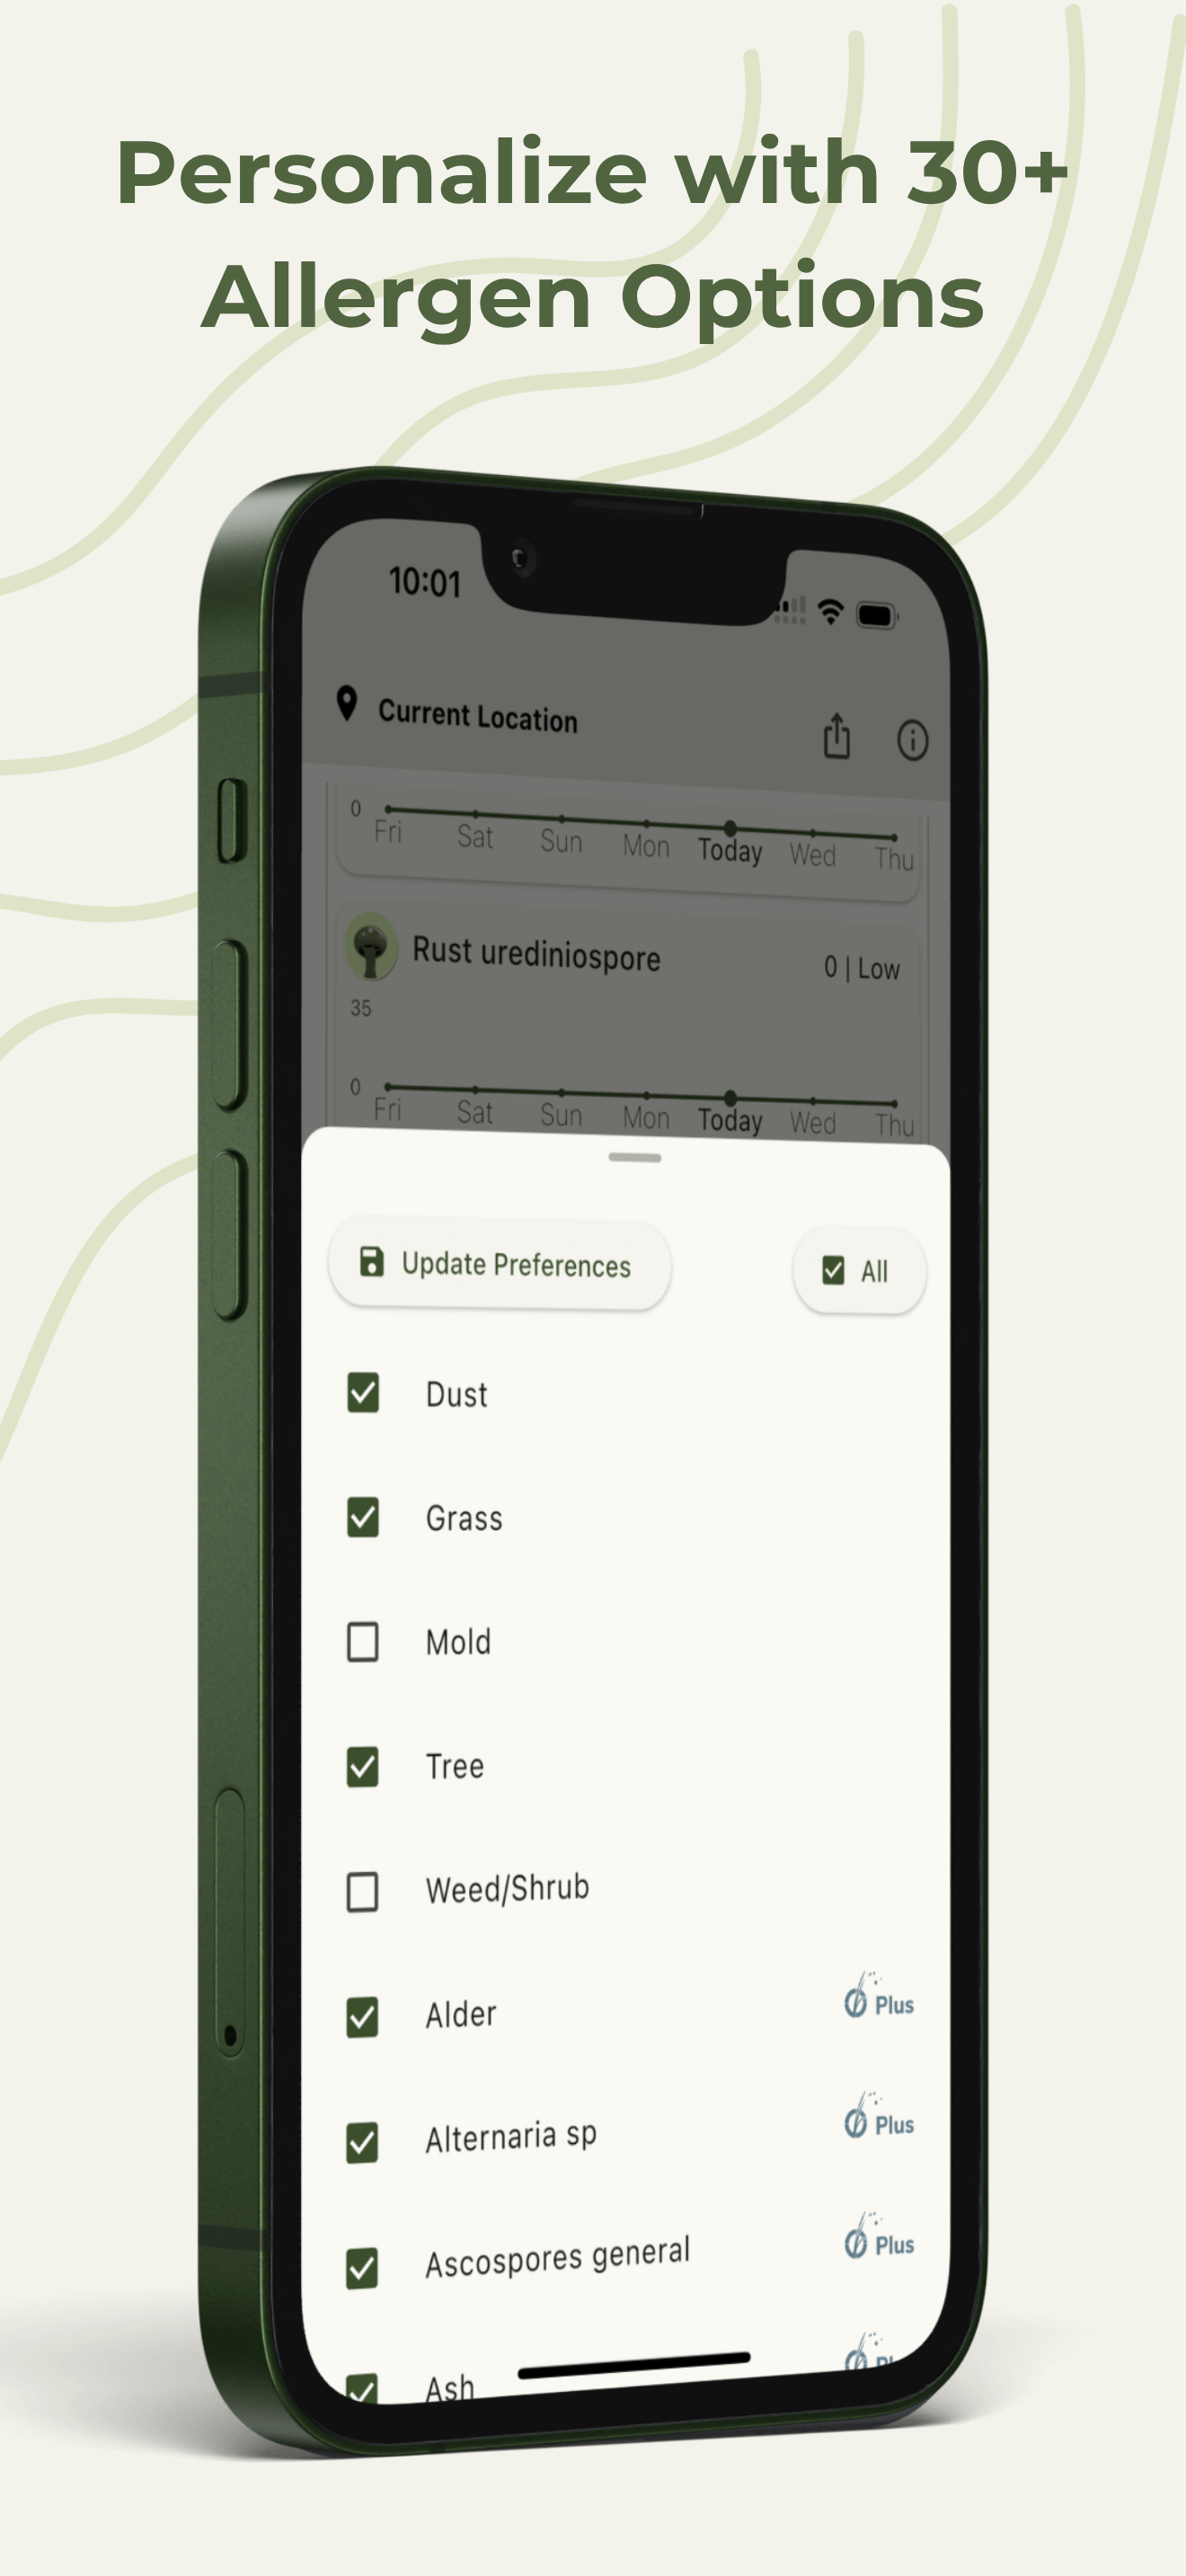
I really like this app and recommend it to others! For me, it's all about the "Dust" levels, as this app is the best app when it comes to information about the Dust levels in other air! This app covers more allergy alerts in several areas, such as Gras, Trees, Mold,-- which is why I recommend it to others. The other feature I love, is when I travel, it allows you to enter the city you are traveling to check on what the air quality and allergies are for that city. This is my go to app every morning!
This is by far the best app for tracking allergies. It includes dust and mold, as well as the seasonal vegetation based pollens. I have a wish list item: I’d like to see a graph section added that shows all categories overlapped together. Like blue line for weeds, red for trees, etc. Reason being that I would like to see if there is a tipping point for symptoms to kick in or get worse. I know I am sensitive to mold at some medium to high, and higher, levels. But there are also times when I have symptoms but can’t tell what the cause is, and I wonder if it’s because of a combination. I’ve swiped back and forth between categories to try to see a relationship, but a combined graph would, or might, make it much easier and plainer. Just a suggestion. Thanks for your excellent information.
Update to my update: My local sensor is back!! Woohoo! Current 4PM readings (%): • Sensor 1 mile away = 23 Tree, 21 Grass, 11 Mold • Sensor 20 miles north = 64 Tree, 21 Grass, 11 Mold • Sensor 20 miles south = 65 Tree, 21 Grass, 44 Mold It really does make a difference in an area like mine that has microclimates (lots of variation in elevation and coastal/inland changes). Update: When I originally started using the app, I was 1 mile away from a sensor. For whatever reason, that sensor stopped yesterday and now I’m 20 miles away. Living in an area of microclimates makes this app less useful now where I live. Data from 20 miles away can’t help me, no matter how well it’s presented. Original: I researched this and couldn’t find another app this granular—every HOUR I can see the tree, grass, mold, and weed pollen/spores. I can finally predict allergy symptoms AND explain to others by showing them actual supporting data! Thank you! Now in the latest update, it shows a percentage (I assume that is the same type of percentage as they mention in the in-app notes). This app was beyond compare before, but now it just blows the others away! The only other app that compares in functionality doesn’t have or use enough sensors. But PollenWise has a sensor 1 mile from my house! Perfect!
Pollen Wise has reached version 5! We've been hard at work transforming data from the network of Pollen Sense sensors into a model that includes great...
| Name | Price | Type |
|---|---|---|
| Pollen Wise Plus (Monthly) | $4.99 | Monthly |
| Pollen Wise Elite (Monthly) | $8.99 | Monthly |
| Pollen Wise Plus (Yearly) | $49.99 | Yearly |
| Pollen Wise Elite (Yearly) | $69.99 | Yearly |


