
Check the acquisition promise
Read the store headline, screenshots and description. What problem is the app promising to solve?
Study the storefront ↗
Chaney Instruments · iOS
Explore the ad evidence, study the storefront, and build your next acquisition hypothesis.
01 / Creative research
Read the store headline, screenshots and description. What problem is the app promising to solve?
Study the storefront ↗Explore apps with direct store-link matches. Compare their hooks and formats without assuming the same approach works here.
Browse observed advertisers ↗Store rankings and revenue estimates describe market context. They do not establish ad spend, conversions or ROAS.
Review the market context ↗02 / Storefront & product
Study the product story and store experience behind the acquisition funnel.

03 / Market context
Keep revenue, downloads and store rankings separate from advertising performance.
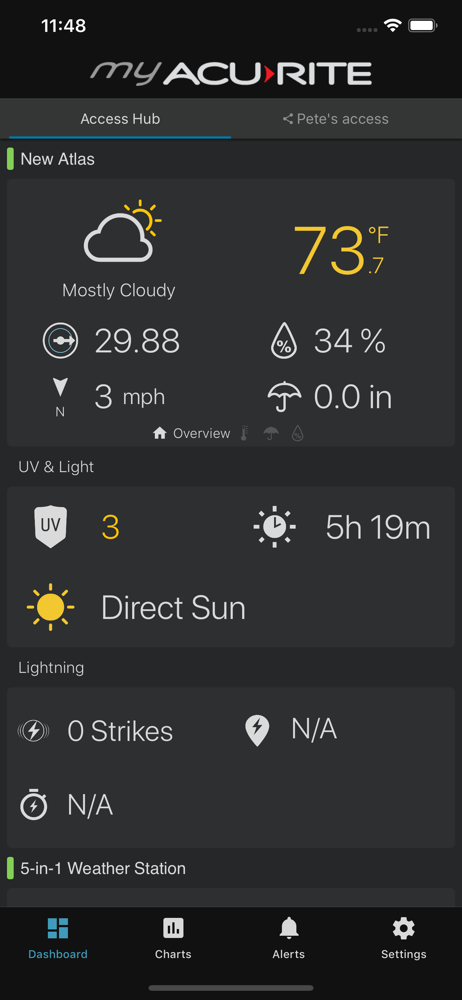
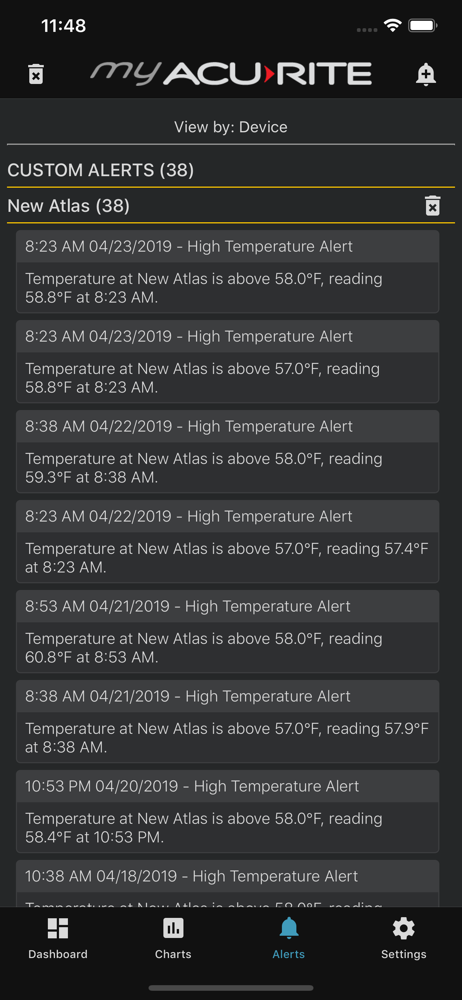
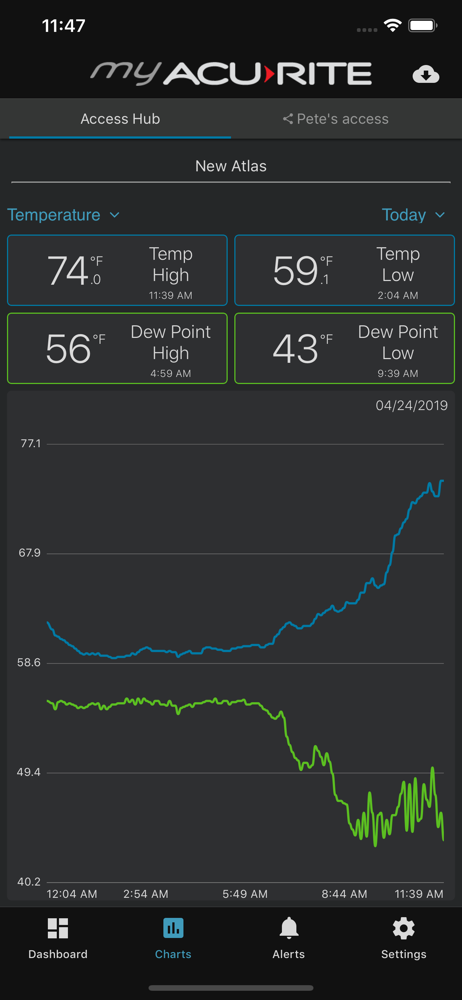
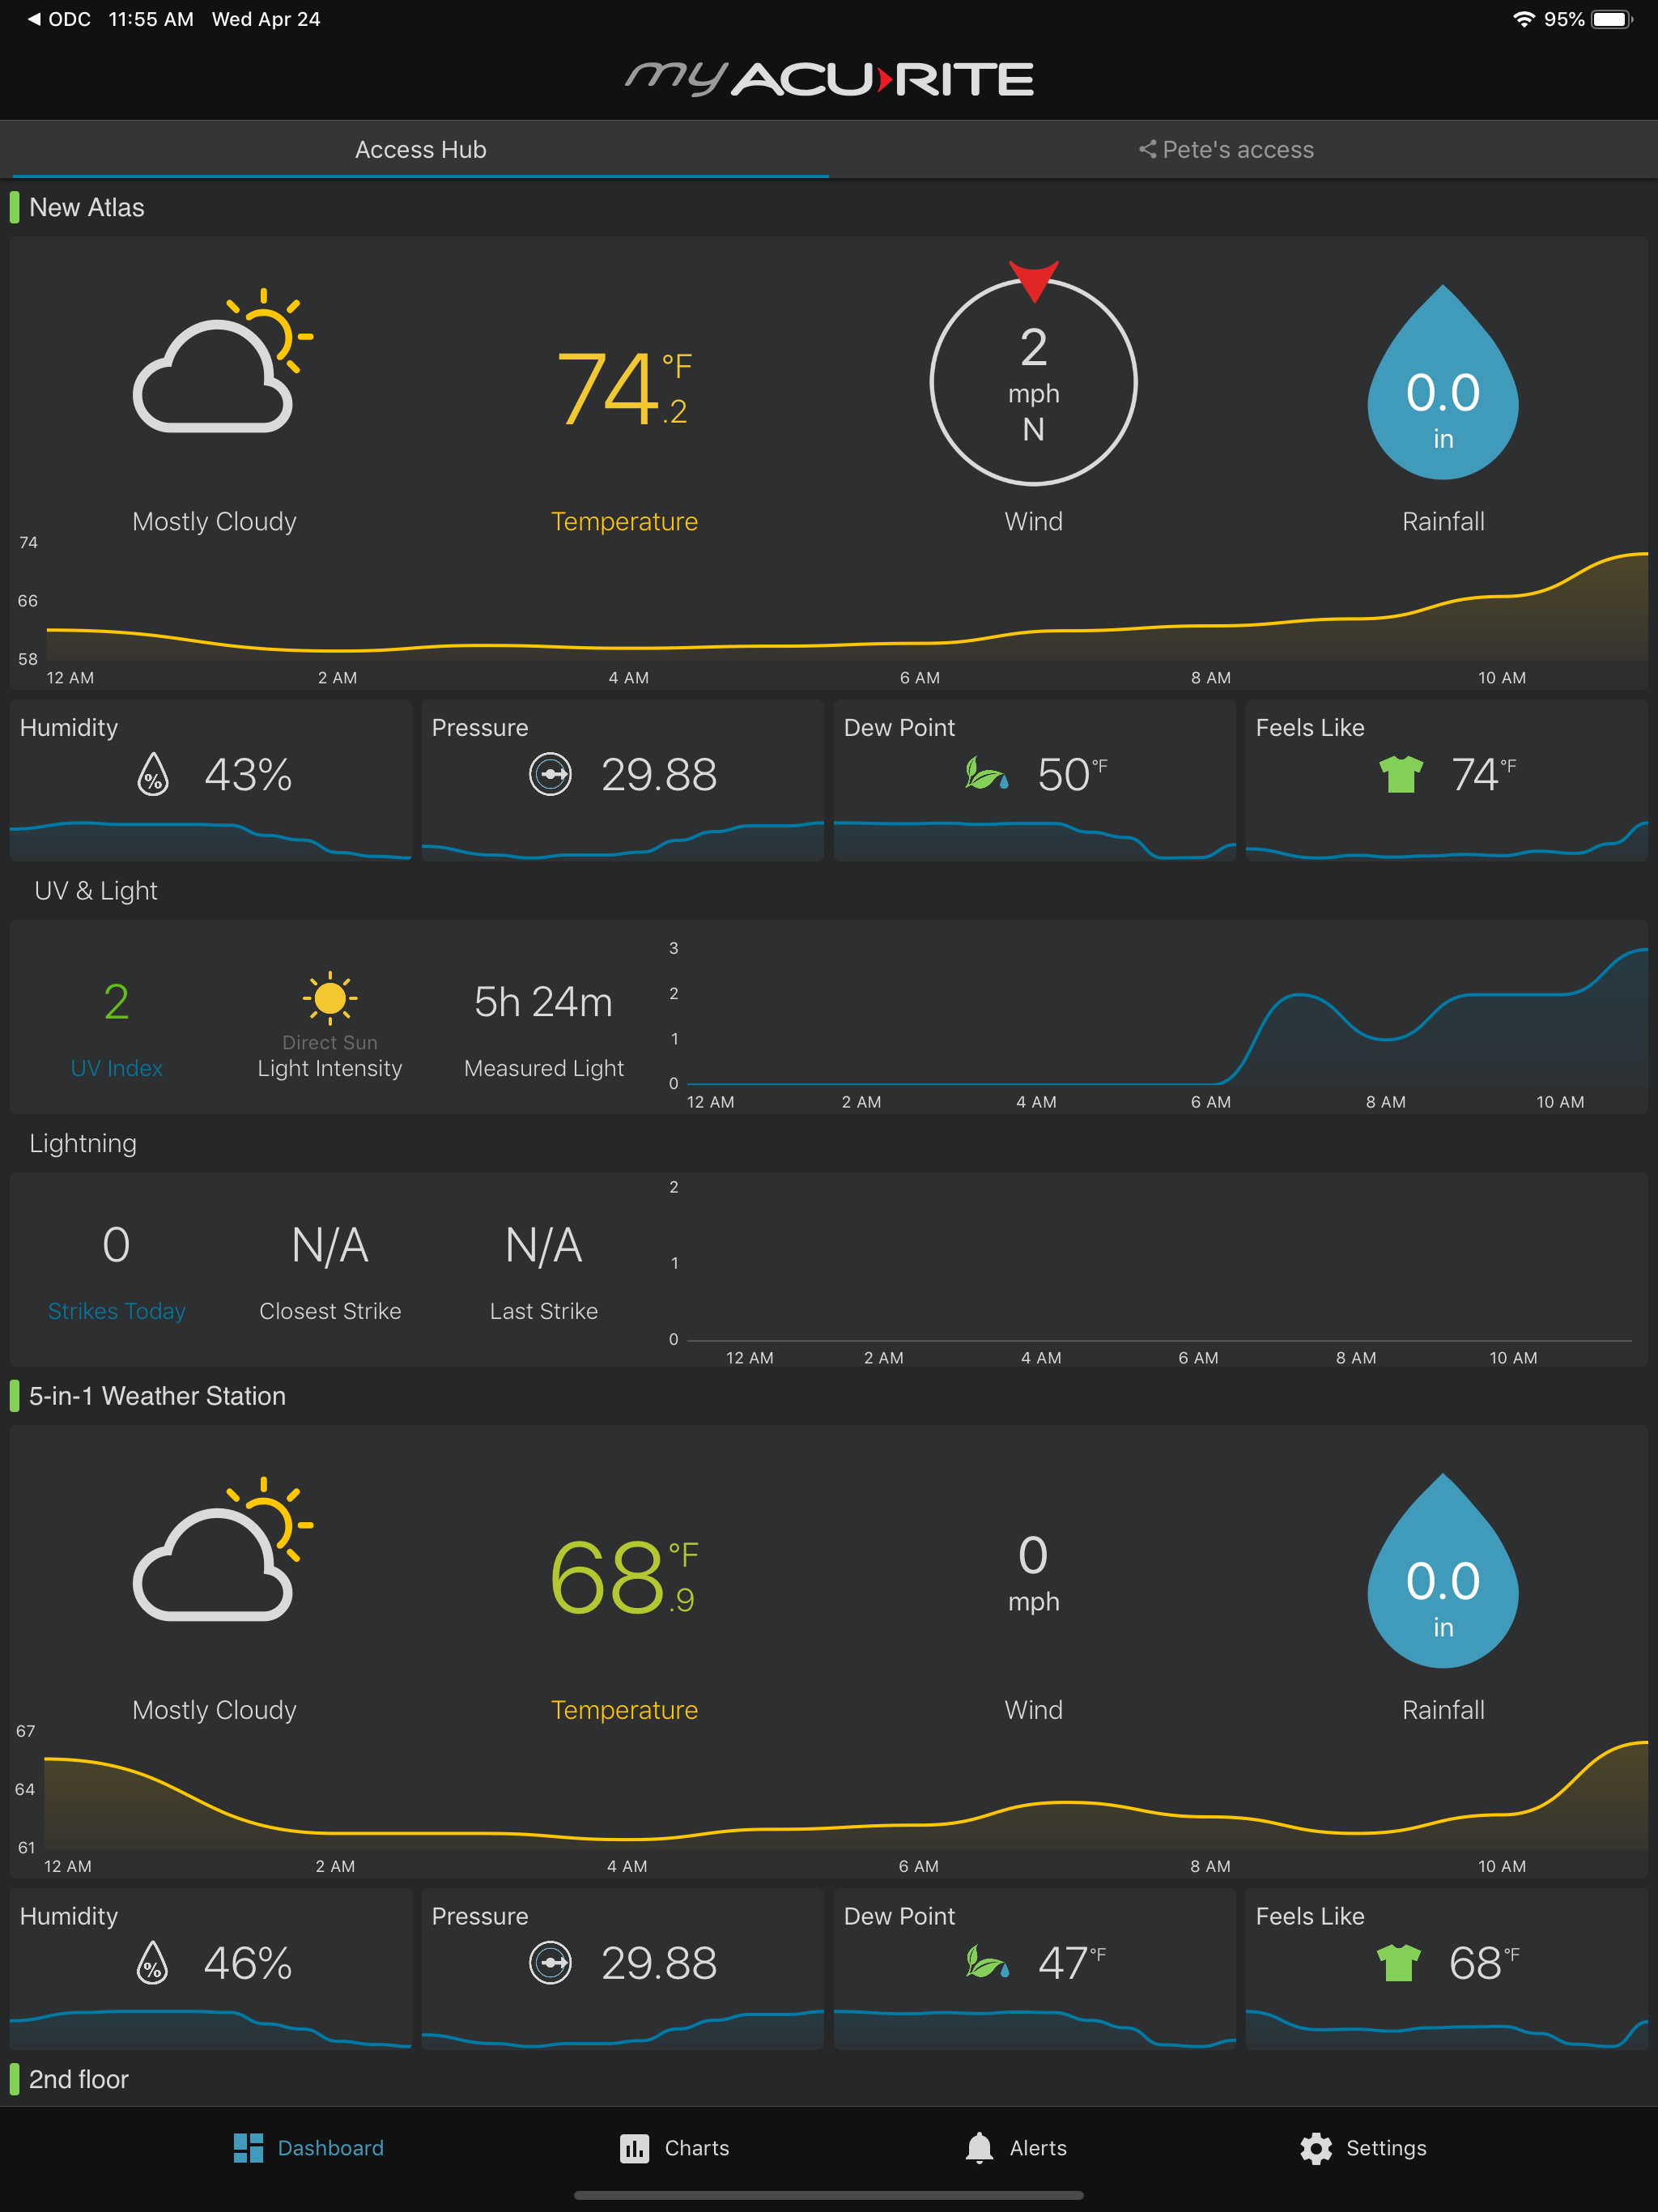
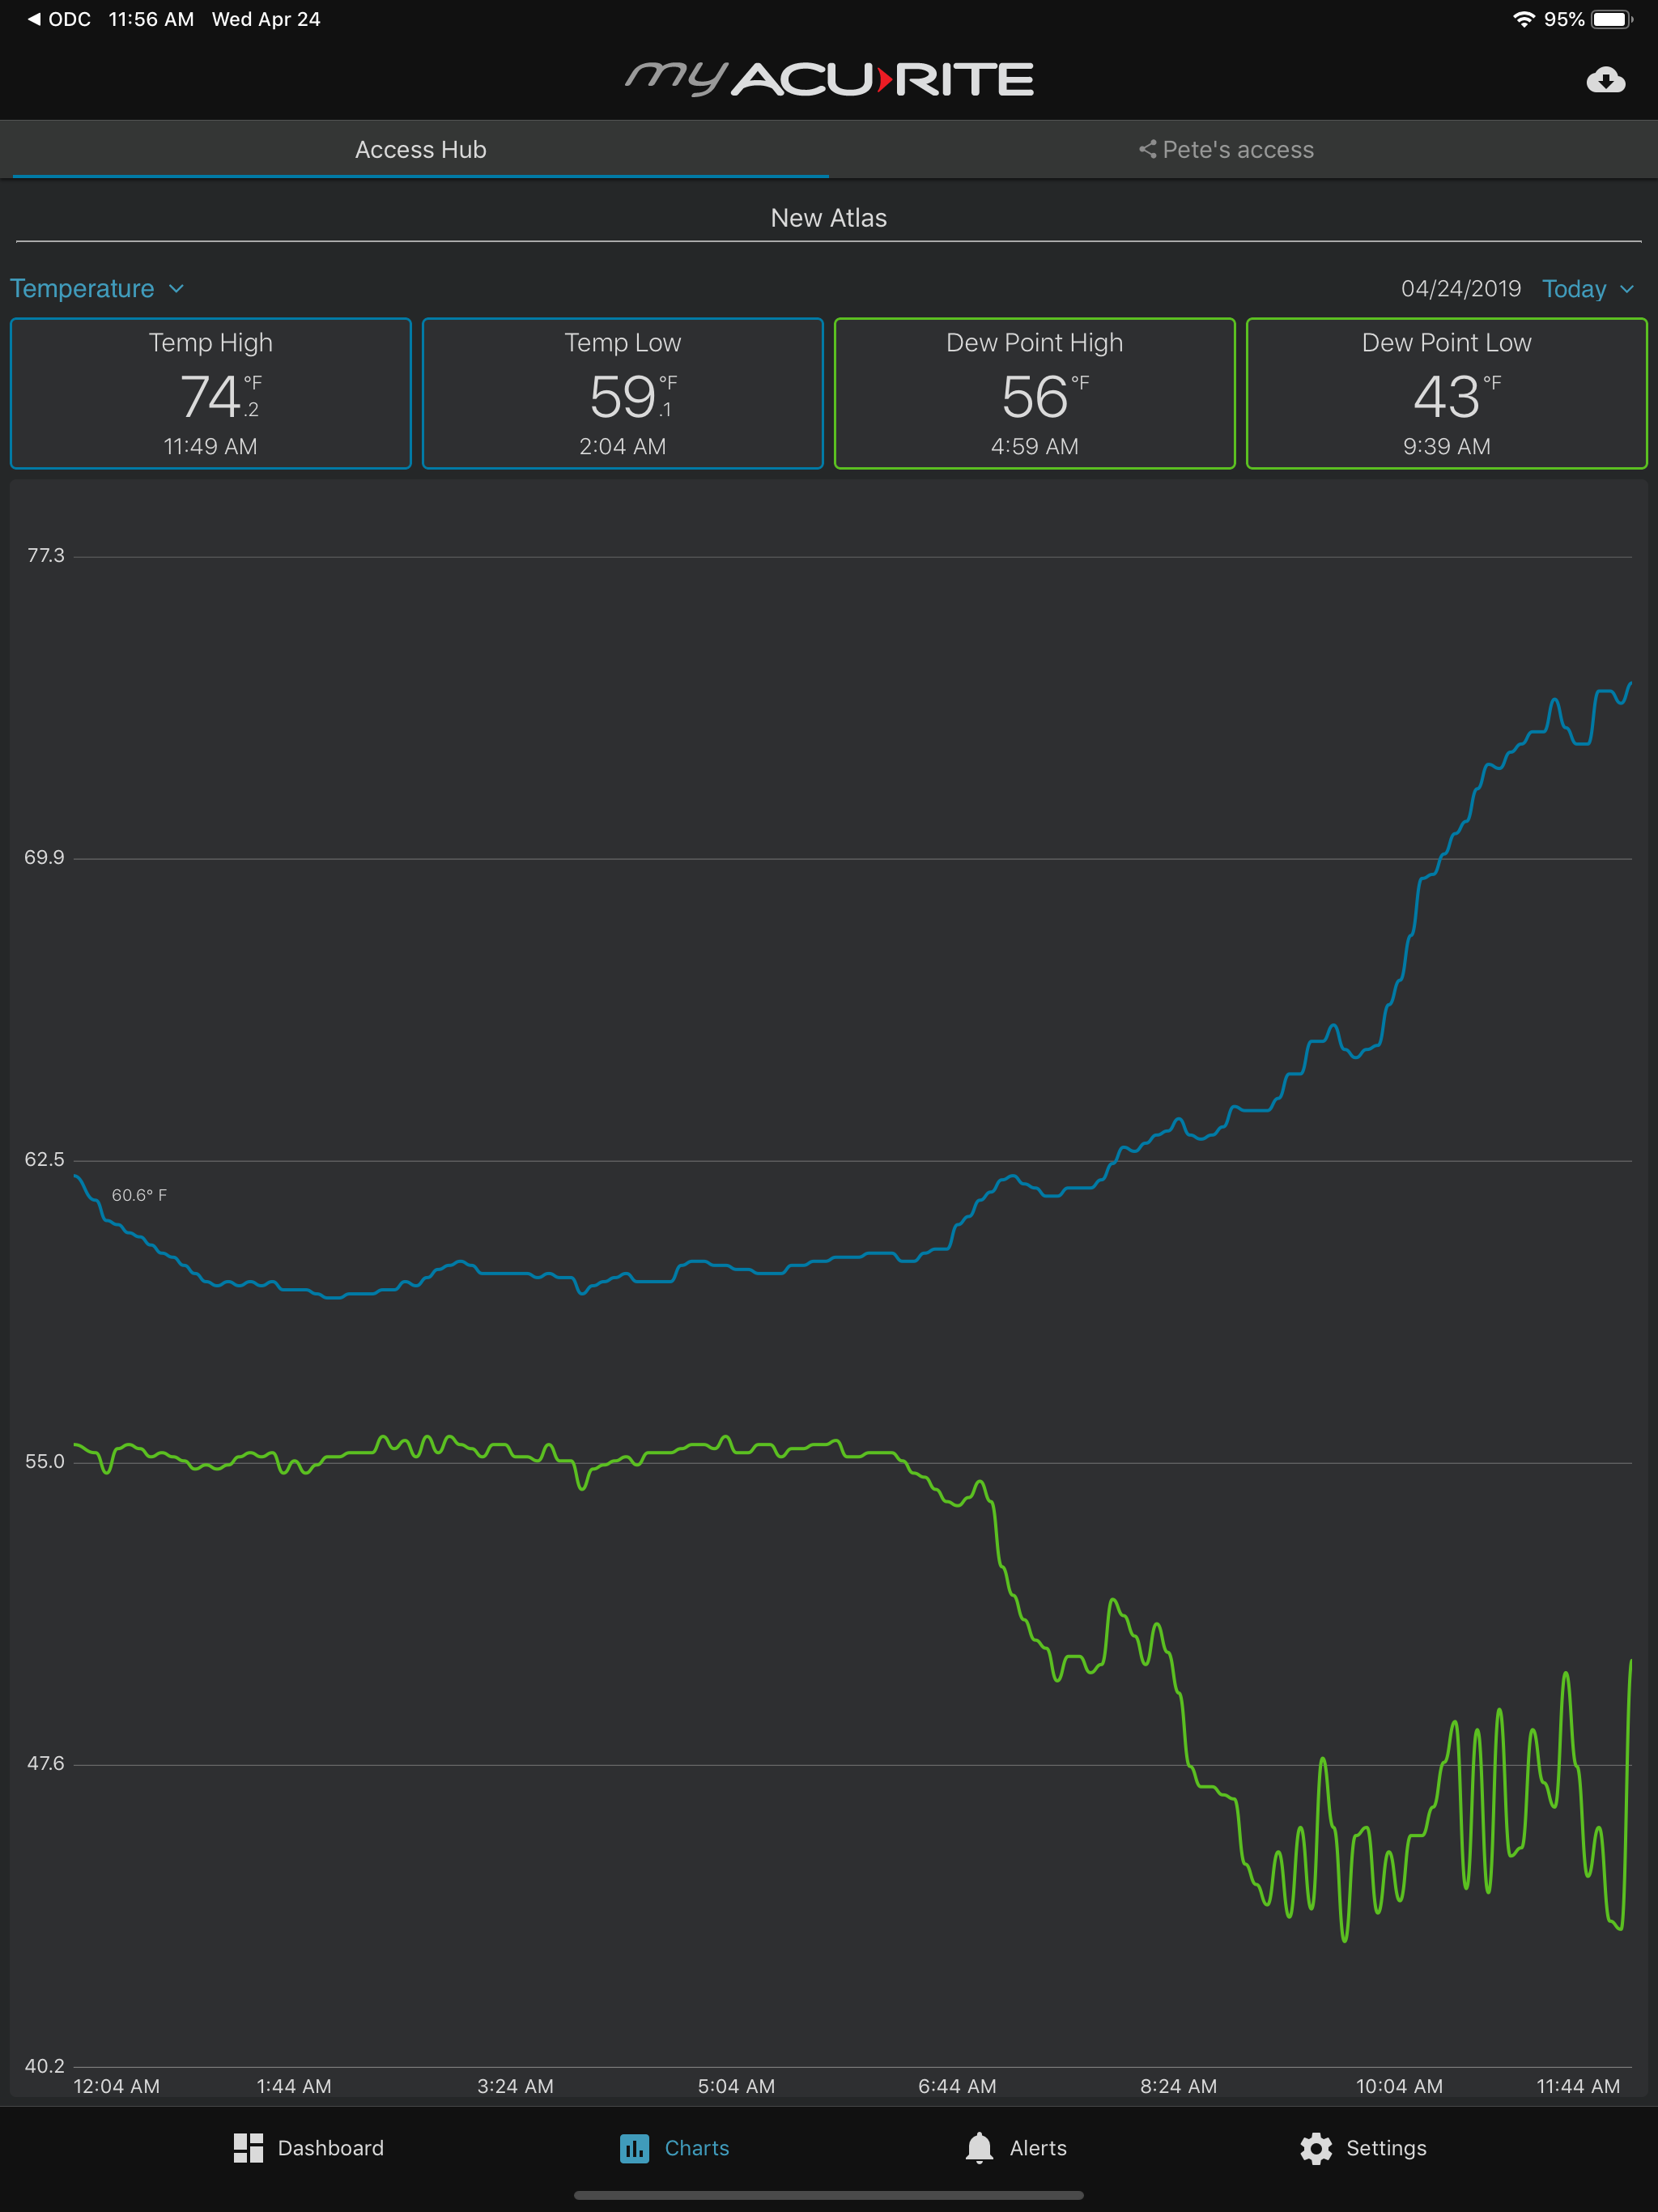
The 24-hour rainfall history, in Charts, doesn't make sense. The purpose of a 24-hour look-back is to see the total rainfall accumulation of that time period, from the time the information is requested. The chart displays "total" and "high" amounts. The total figure displays the amount of rainfall from midnight of the day the information is requested, not the total rainfall of the previous 24-hour period. The "high" figure displays the total amount in the 24-hour period -- that doesn't make any sense. Unless you're wanting the most rainfall in a smaller timeframe within that 24-hour period, an hour, for example, "high" is illogical. It's merely a problem in the algorithm of the chart, for the previous 24 hours. Also, at midnight of the 24-hour rainfall history, the rainfall amount drops to zero. Again, illogical. The graph should display an accumulation in a 24-hour period -- assuming there was rain prior to midnight. This should be a simple problem to fix. Additionally, there appears to be no other way to communicate this type of issue to the app developers, other than by means of an app review.
I recently upgraded to an Atlas Direct to WlFi system. Easy to install equipment, a bit more challenging to connect to WiFi. Once connected, the info, tables and graphs were great. The first display, however, had issues. It wouldn’t maintain memory if the power went out despite having batteries, the lightning strike counter couldn’t decide what to show and, the display information would sporadically disappear and reappear on the AcuRite app and Wunderground app. Even though the display was constantly connected to my internet, a fiber optic system with an Orbi mesh router, the apps would show the unit as offline. AcuRite replaced the display and I’ve been running it four days. The issue with the display going offline to the apps continues. The original display would transmit fine for a few days, drop out for several hours, and then comeback on line. This happened numerous times. The replacement display, now beginning it’s 5th day in operation, went offline 9 hours ago and is still out though the display is connected to my internet. This would be a great system if it worked full time, but it doesn’t. The reason I upgraded to this system was to have the internet connection. Looks like I need to return the whole system and find another provider. BTW-don’t expect support. No connection by phone, only by email. Most responses only refer you to online information you likely already read.
The equipment and graphics are pretty ok! Even if I refresh my app, the internet bridge only communicates information every three minutes or so. This is the opposite of helpful for things like wind gusts, which is one of the things I looked forward to the most when I got this setup. It’ll report on the at-home display, but the app misses so many wind gusts due to infrequent reporting. I would love to see an option like using more battery life in exchange for more frequent data updates on the app, but I’m not optimistic... I’m strongly considering changing brands of weather station for a setup that will provide more frequent updates. I really want more frequent updates on the app and the ability to pick imperial or metric for each reading on the app. If you’re interested in temps, rainfall, and a few other readings, this is the app and weather station for you. If you’re interested in wind like me, don’t get this equipment or app.
With My AcuRite smart home systems for environmental monitoring, you can stay connected to your surrounding environment, and keep tabs on all the plac...


