
Check the acquisition promise
Read the store headline, screenshots and description. What problem is the app promising to solve?
Study the storefront ↗
Bearinc LLC · iOS
Explore the ad evidence, study the storefront, and build your next acquisition hypothesis.
01 / Creative research
Read the store headline, screenshots and description. What problem is the app promising to solve?
Study the storefront ↗Explore apps with direct store-link matches. Compare their hooks and formats without assuming the same approach works here.
Browse observed advertisers ↗Store rankings and revenue estimates describe market context. They do not establish ad spend, conversions or ROAS.
Review the market context ↗02 / Storefront & product
Study the product story and store experience behind the acquisition funnel.




03 / Market context
Keep revenue, downloads and store rankings separate from advertising performance.
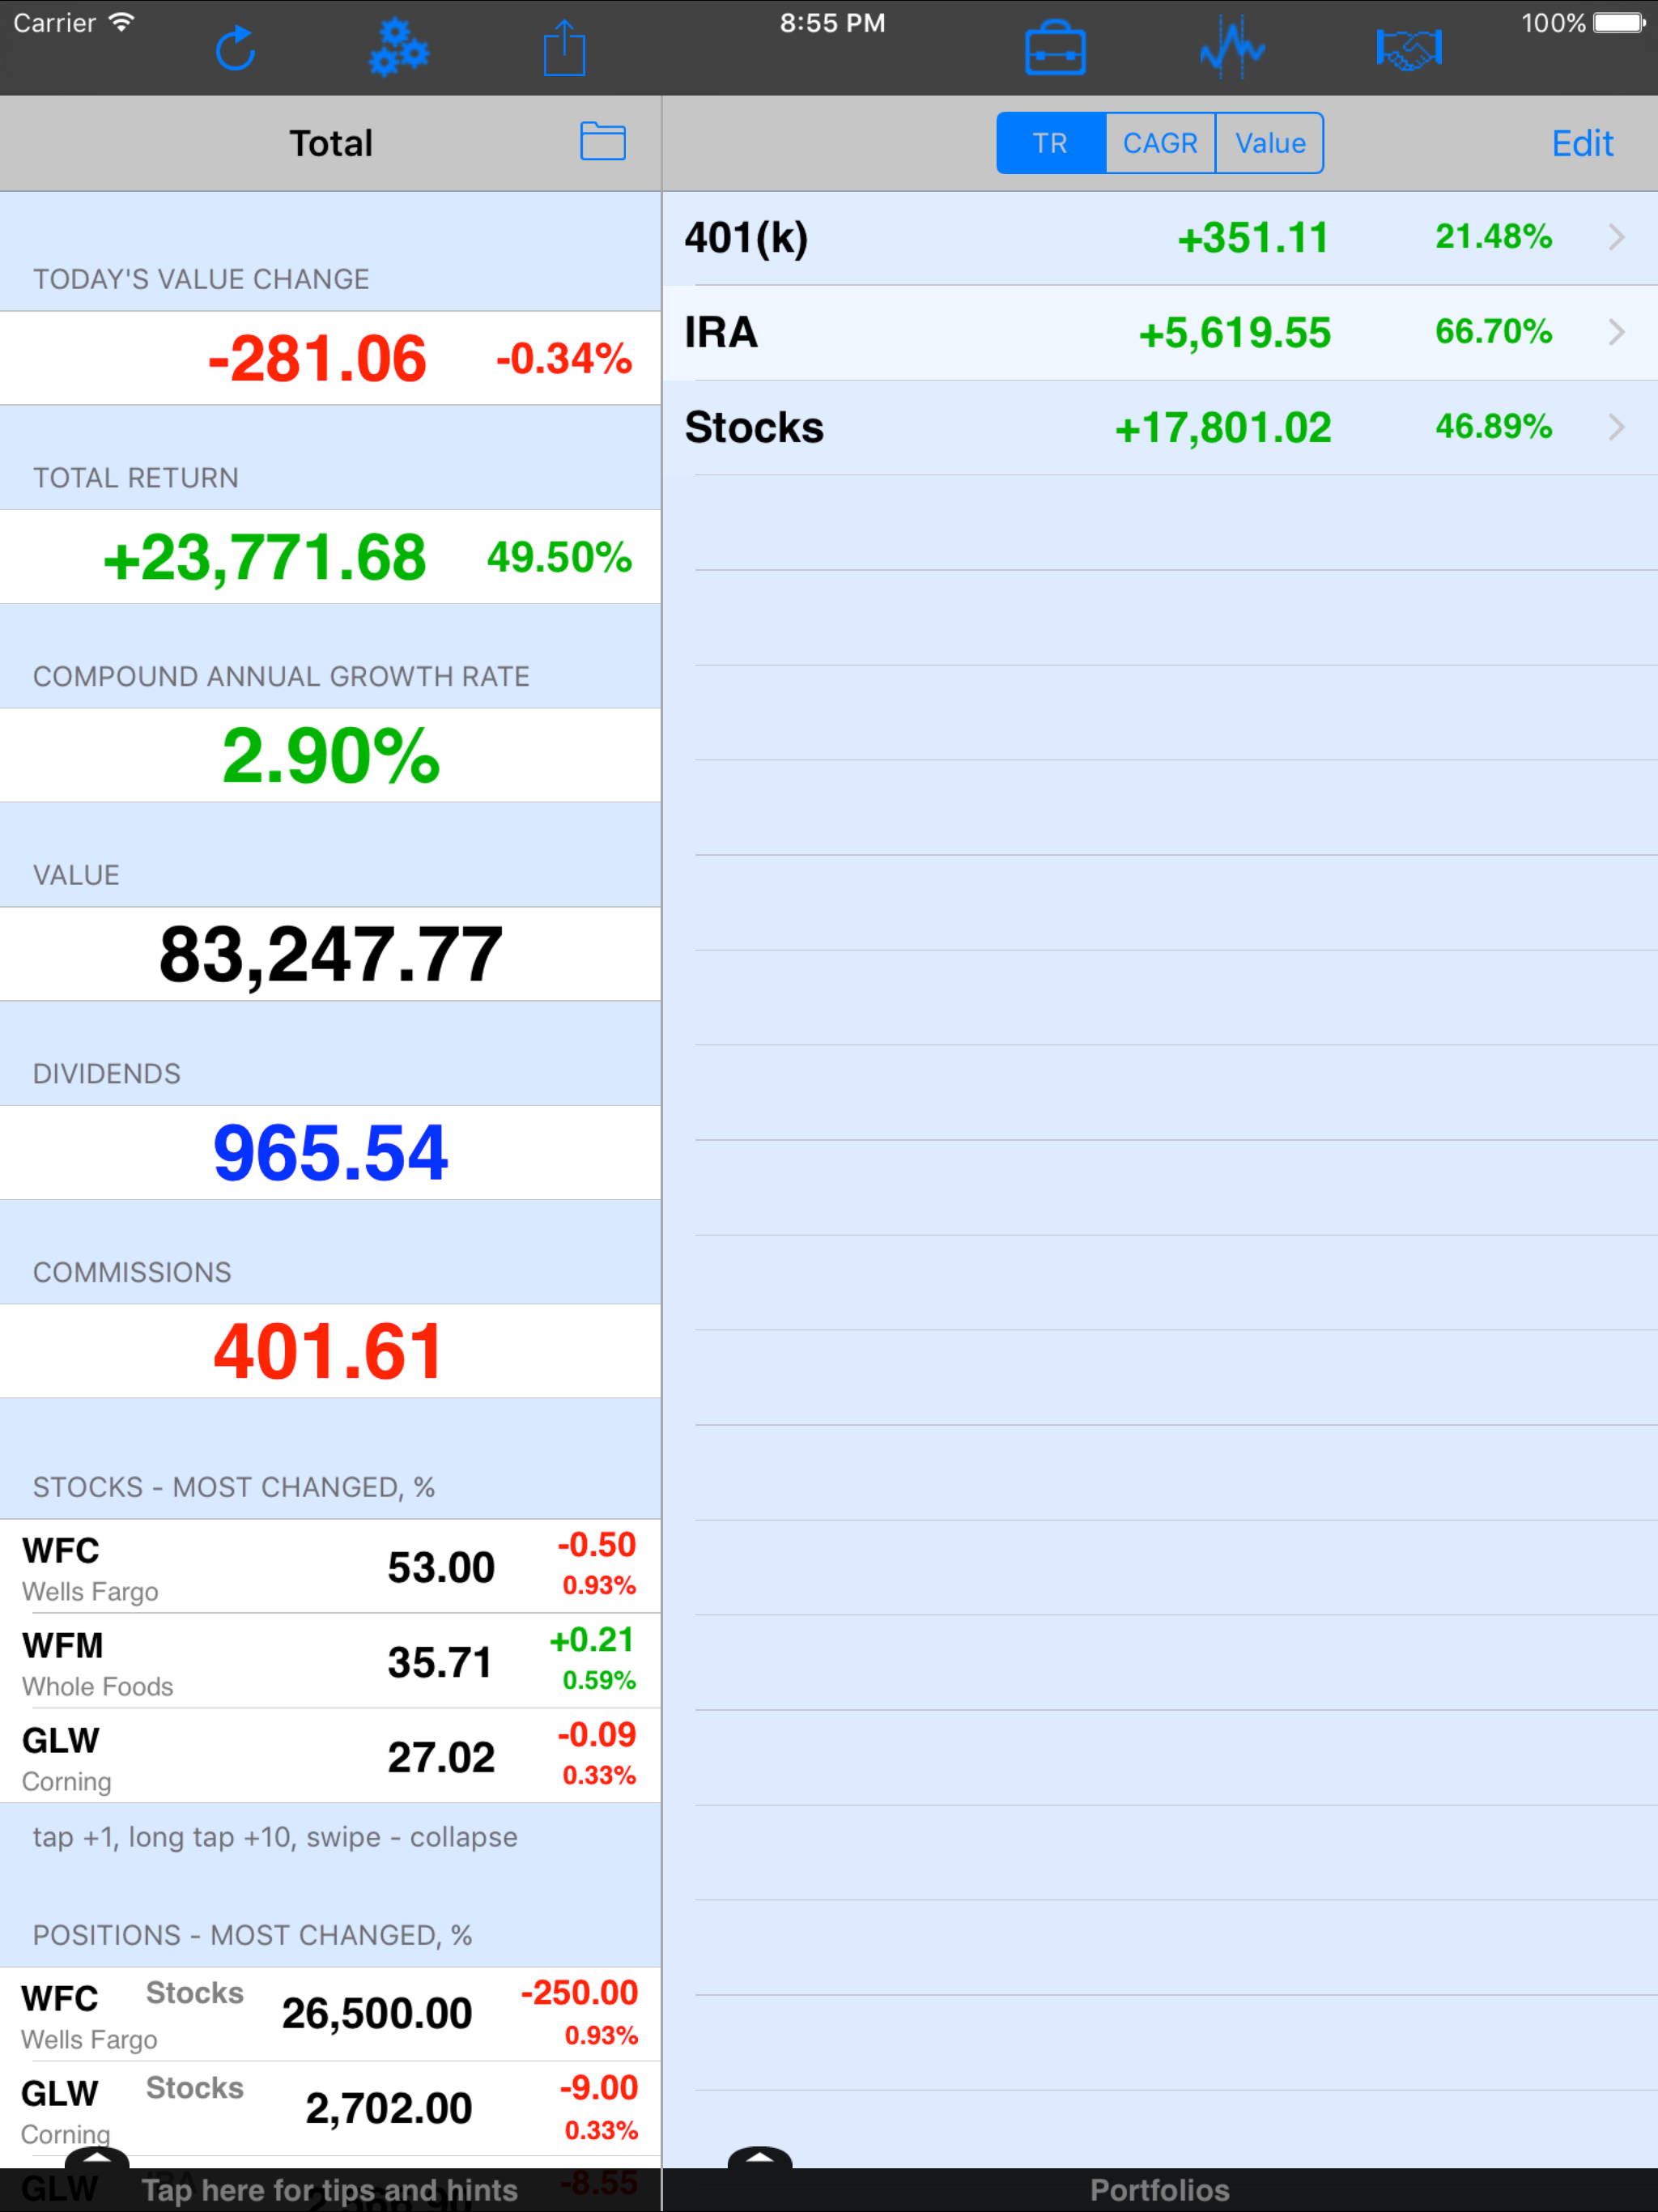
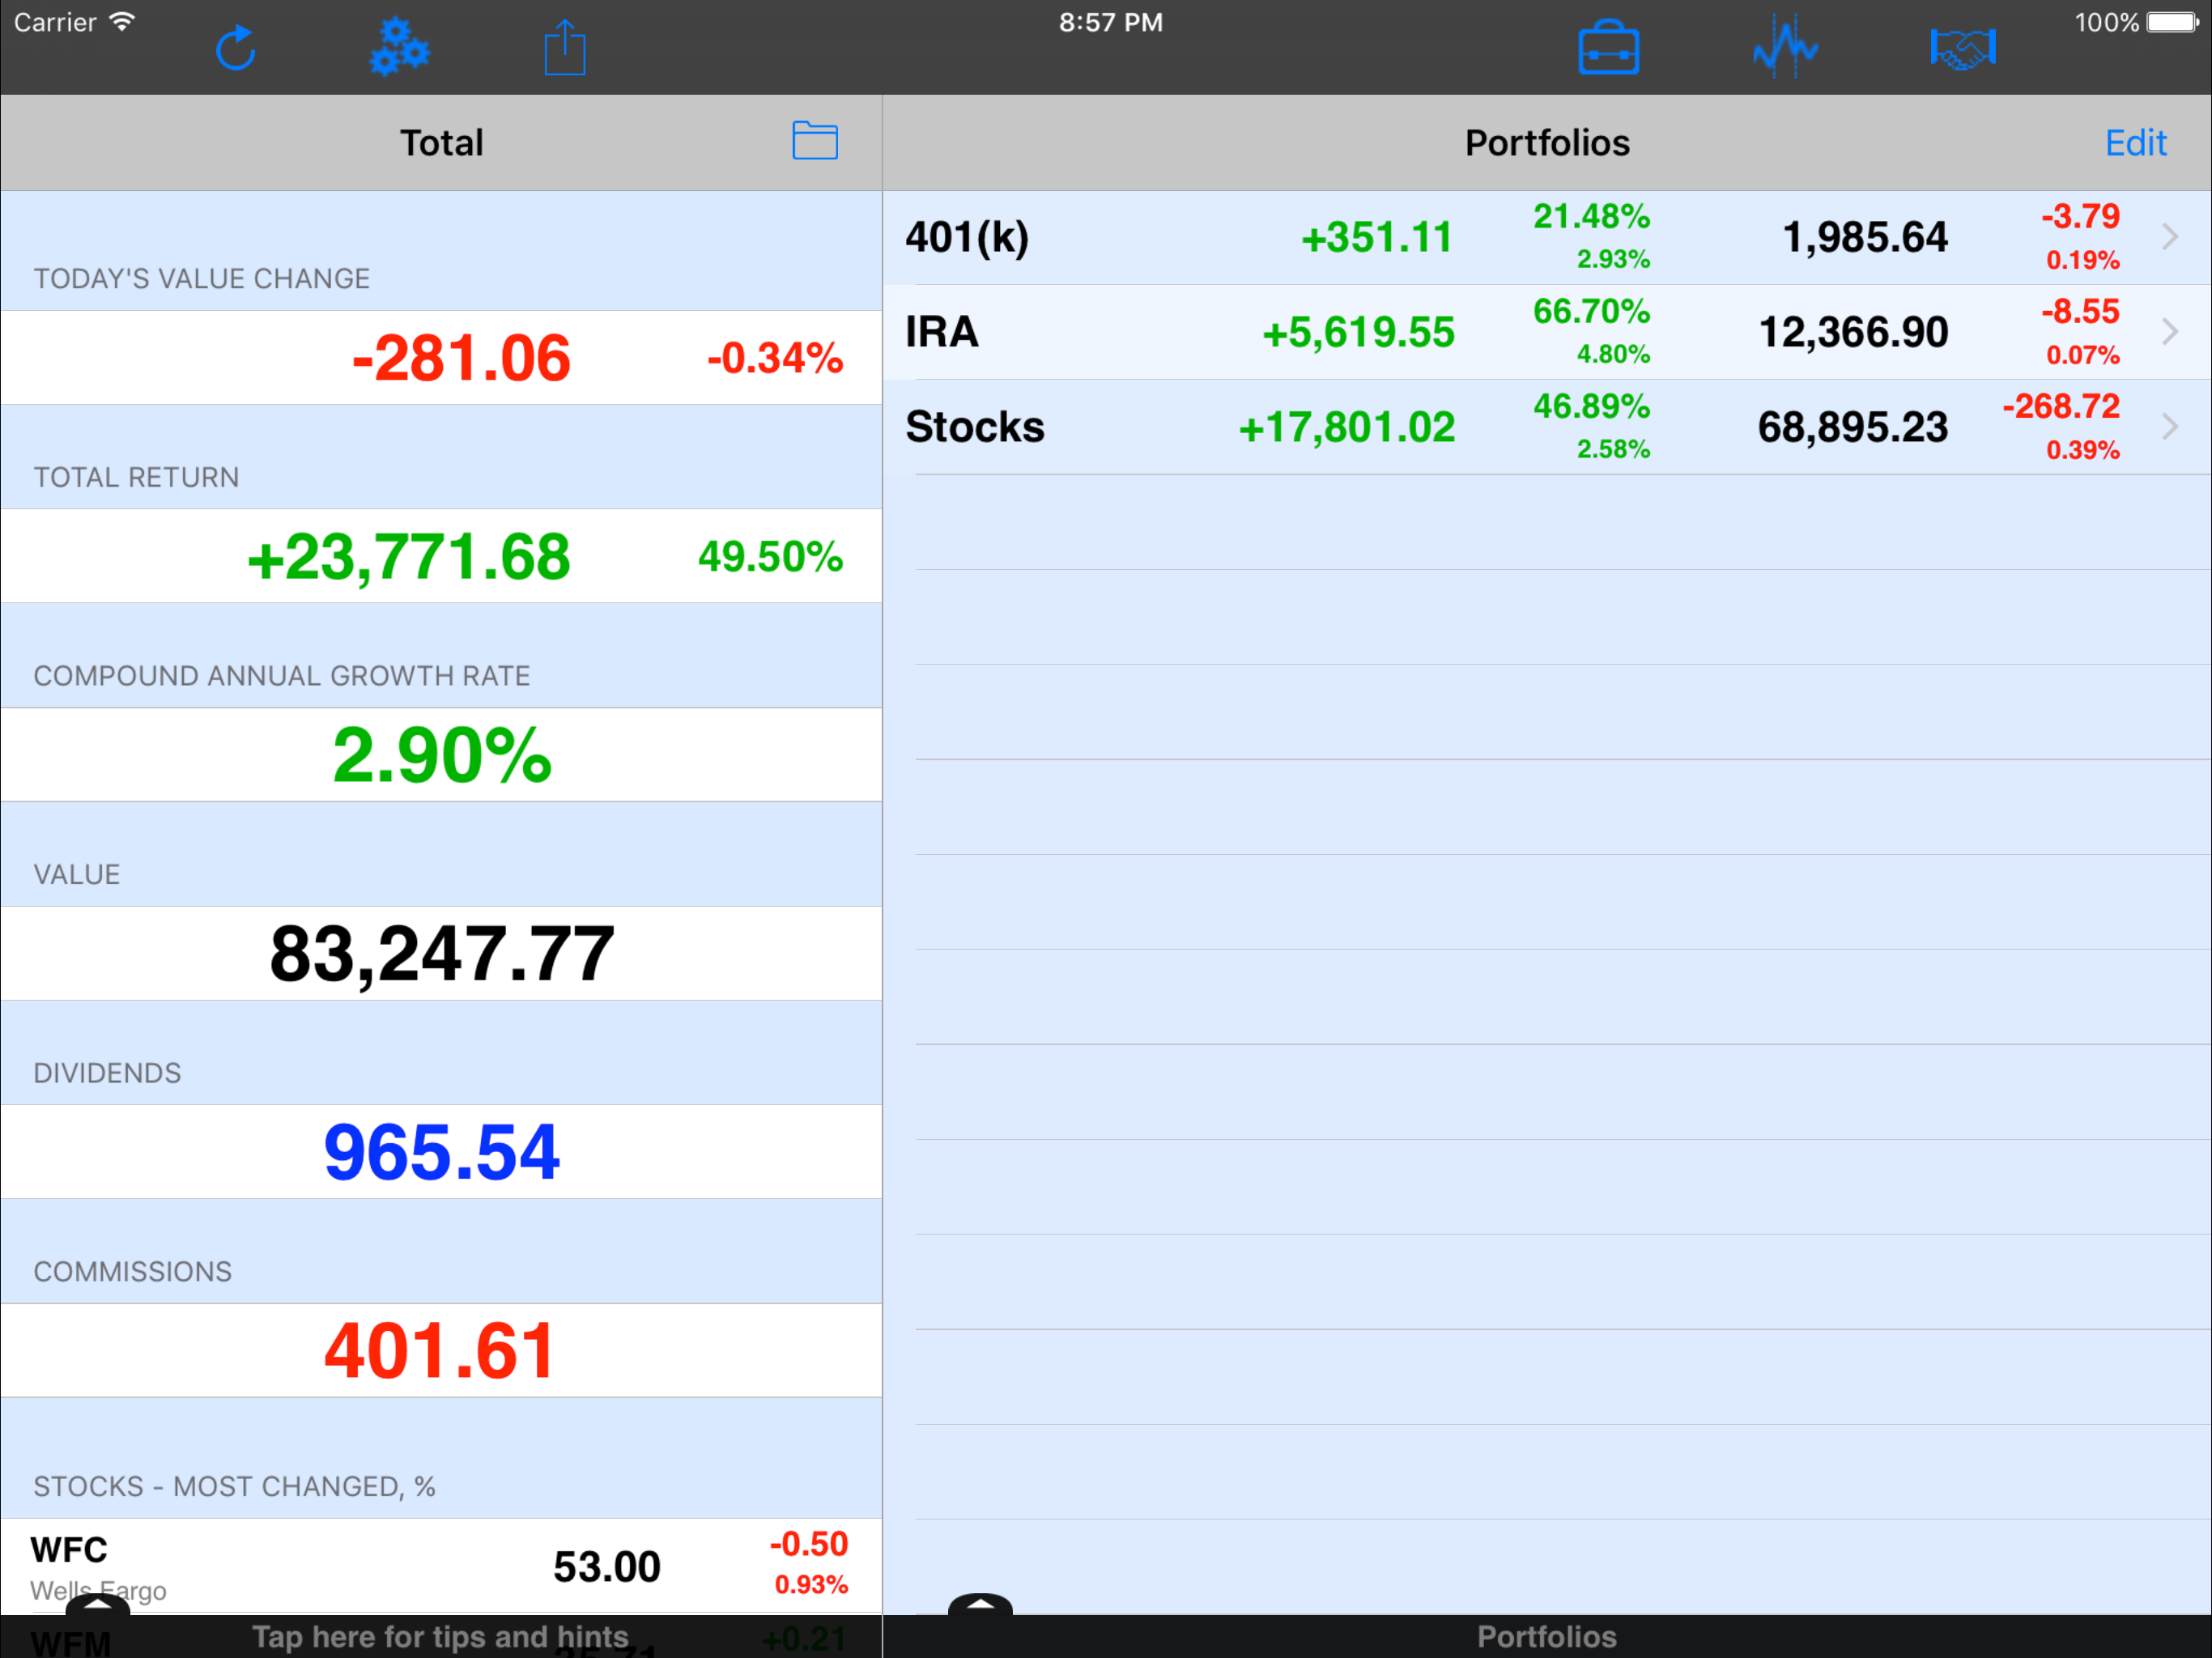
This app is the best I have found to quickly monitor my portfolio results. It is easy to use and provides a better overview of my portfolio than the reports provided elsewhere. It is well worth the $3/month subscription fee to be able to see results quickly on my iPhone or iPad and know how my portfolio is performing with a quick glance. I have used this app for many years and I highly recommend it for anyone who is managing their own investments.
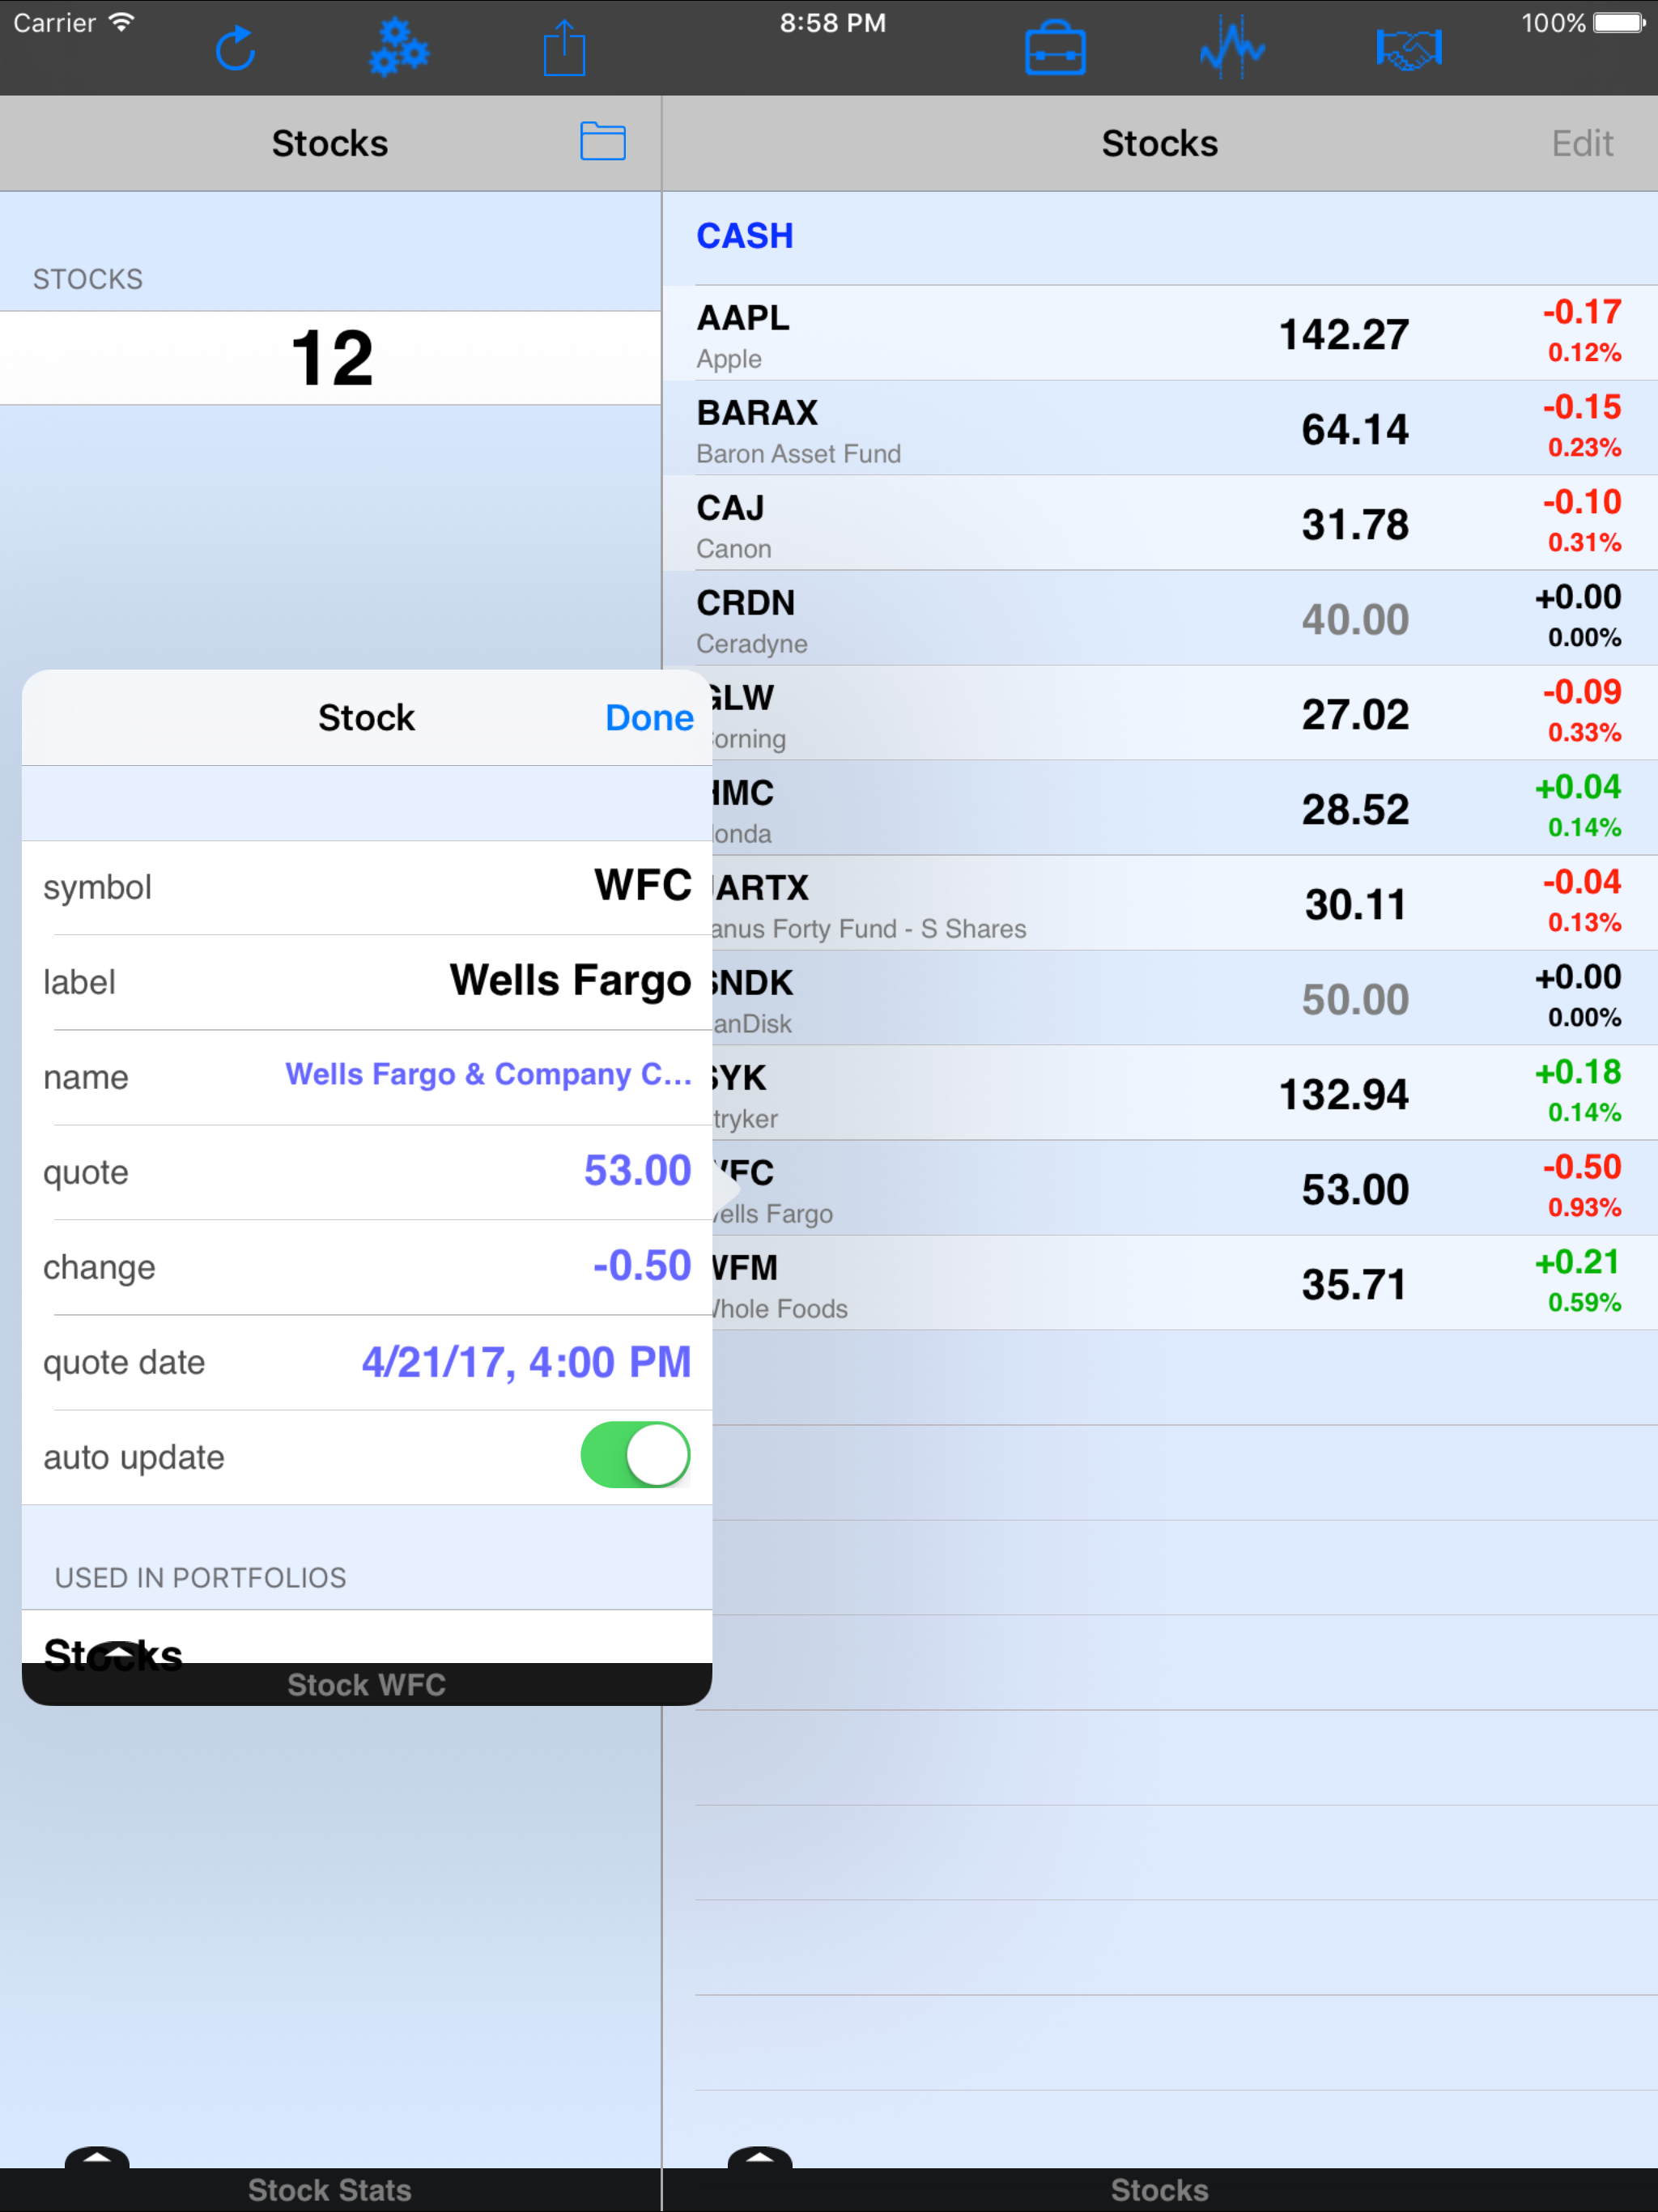
First, the reviewers claiming the app not work with mutual funds are not 100% correct. The app does update the price for mutual funds each day. However, what it does not do is update the change in price from the previous day. This means you cannot use the app to check how much your portfolio has increased or decreased since the previous day as the changes (absolute price and percent) will always be zero if all you own are mutual funds. Second, pay attention to the reviews that highlight the app requires the user to manually enter dividends. It is a lot of work to do this. Think of the days when people used to balance their checkbook once a month. Now, think of doing this ever time you use the app. The cloud based data suppler they are using (IEX Cloud) provides dividend information. Thus, the app should be able automatically do this whenever it updates the total value of the portfolio. Third, the app should be able to link with individual brokerage accounts. This would eliminate the need to manually enter any information and ensure its calculate total value matches what your brokerage firm is reporting. Doing this would also allow it to report fees. Fourth, adding some simple graphs would also improve the app. This could be as simple as plotting “total return” (plot what the app actually calculates). Still, the app is more valuable than apps that do not consider dividends. This alone gets it 2 stars.
By far THE BEST app for the common investor. Easy to use and gives you the info you really need. Unlike other portfolio tools this one calculates TOTAL Return ( includes dividends). Most others don’t include dividends in their return calculations so all you see is the stock price appreciation, which is not your real return. With this tool you compare Apples to Apples! you can compare appropriately between stocks and mutual funds. I've been using for many years and totally satisfied.
Have you ever wanted to know how much you’ve actually gained from your stock or ETF investments including all purchases, sales, dividends, and commiss...
| Name | Price | Type |
|---|---|---|
| Unlimited access (Monthly) | $2.99 | Monthly |
| Unlimited access (Annual) | $29.99 | Yearly |


