Stock Map: S&P 500 Heatmap

Nazim Can Altinova · iOS

Stock Map: S&P 500 Heatmap

Explore the ad evidence, study the storefront, and build your next acquisition hypothesis.

Paid-ad activity not yet verified
Compare appsMy watchlist

01 / Creative research

Turn the unknowns into a research plan.

01

Check the acquisition promise

Read the store headline, screenshots and description. What problem is the app promising to solve?

Study the storefront ↗
02

Look for ad evidence

Explore apps with direct store-link matches. Compare their hooks and formats without assuming the same approach works here.

Browse observed advertisers ↗
03

Separate demand from paid growth

Store rankings and revenue estimates describe market context. They do not establish ad spend, conversions or ROAS.

Review the market context ↗

02 / Storefront & product

Where the click lands.

Study the product story and store experience behind the acquisition funnel.
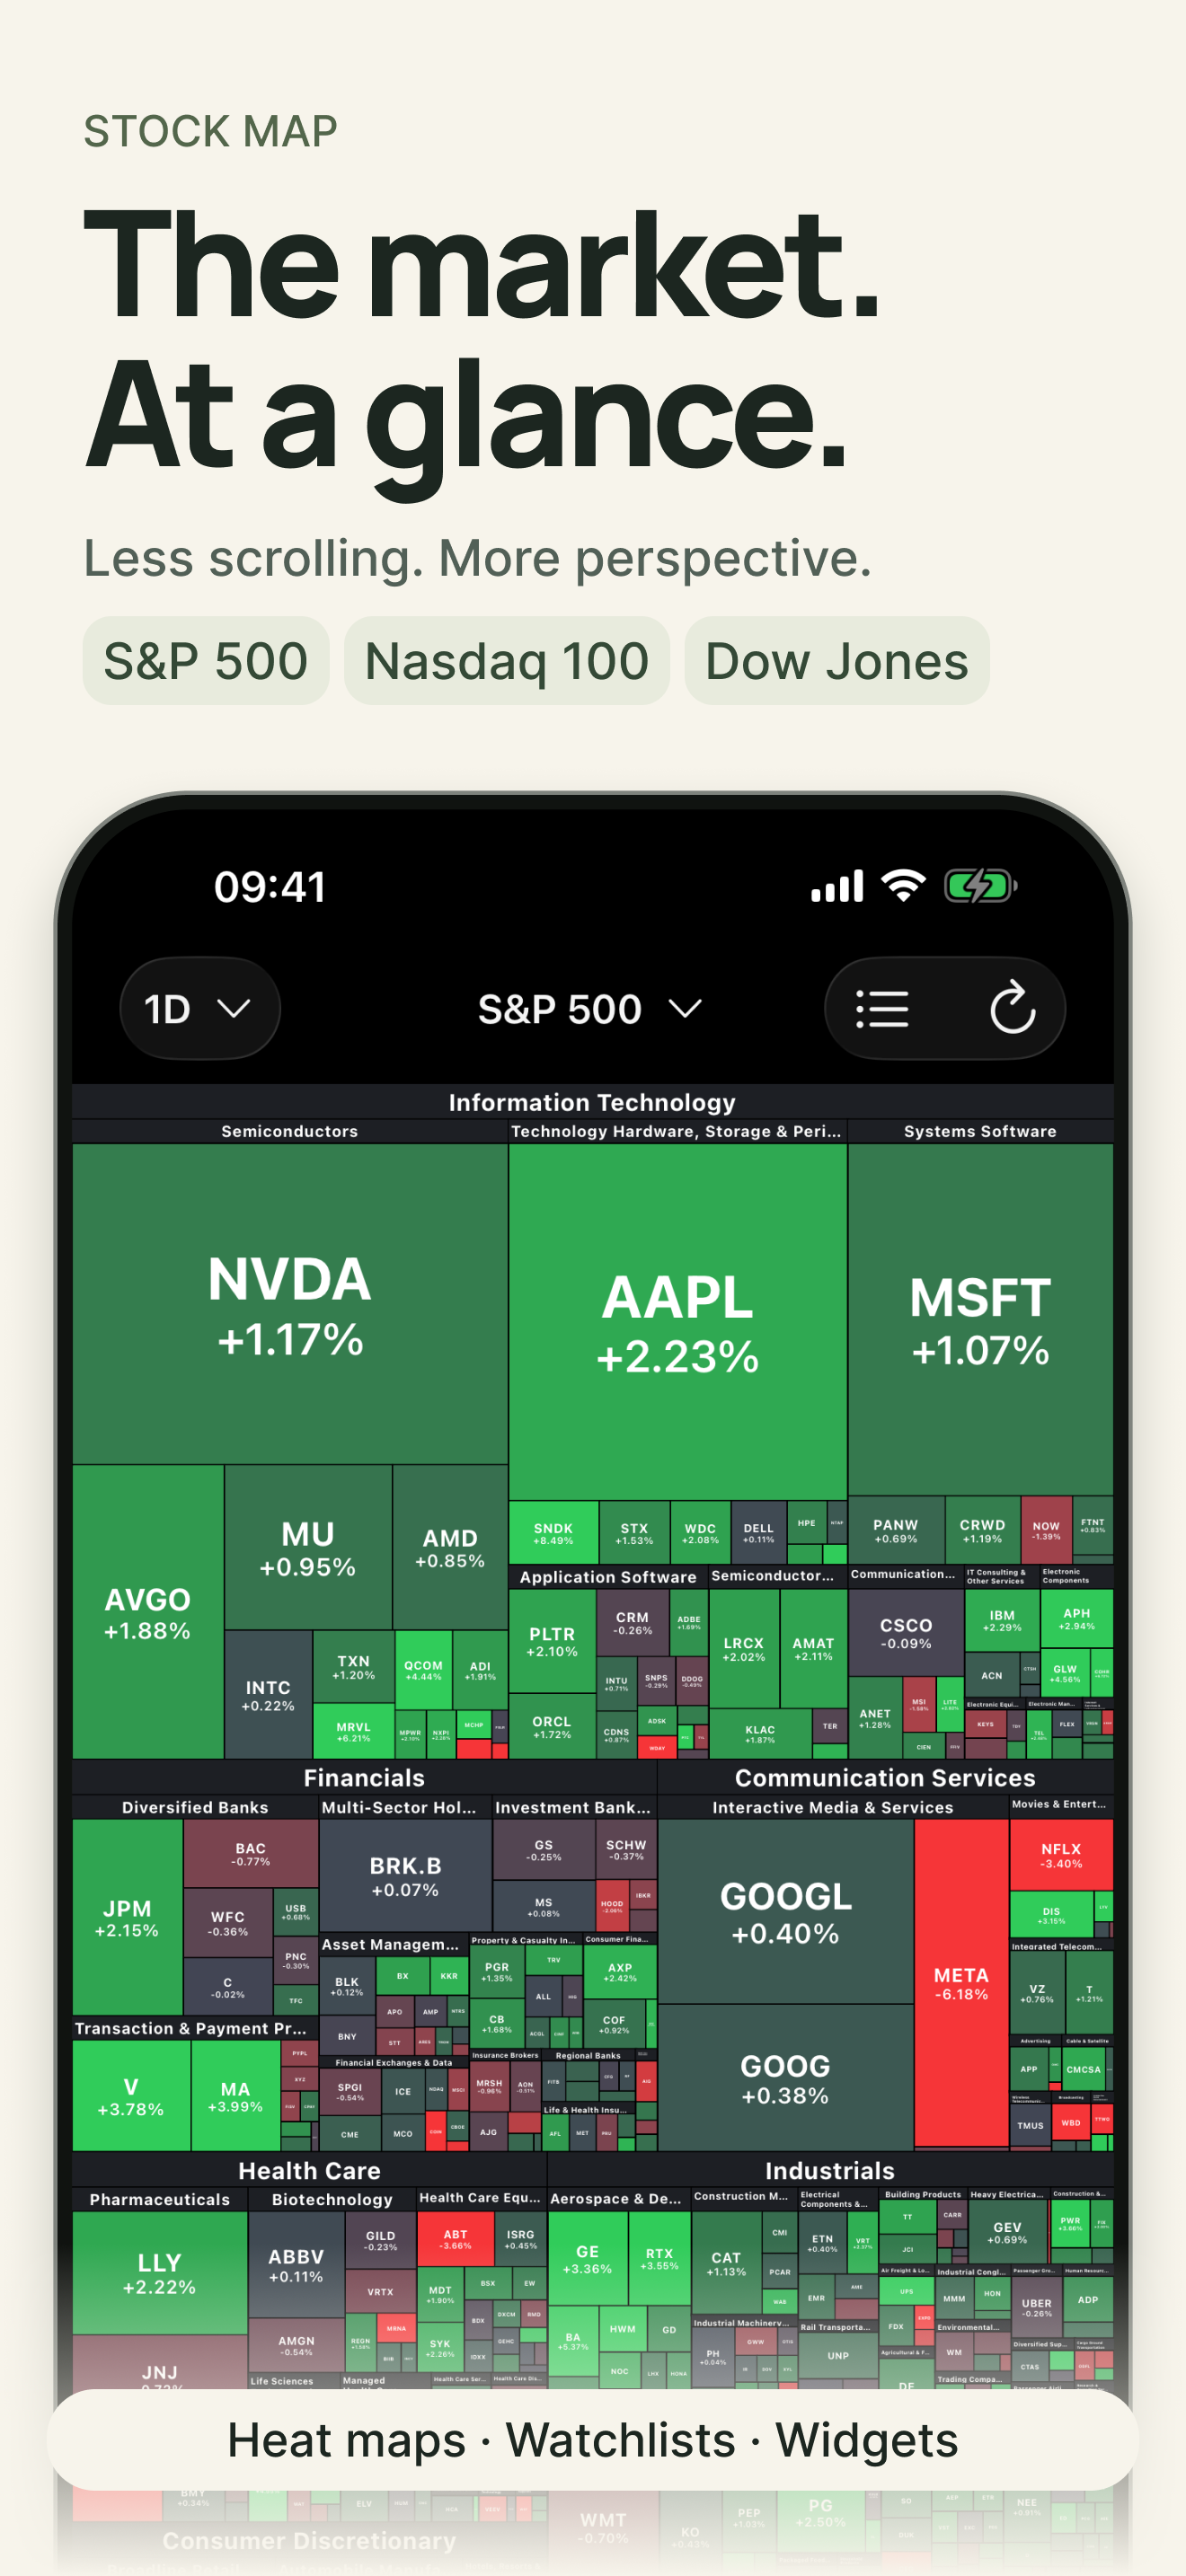
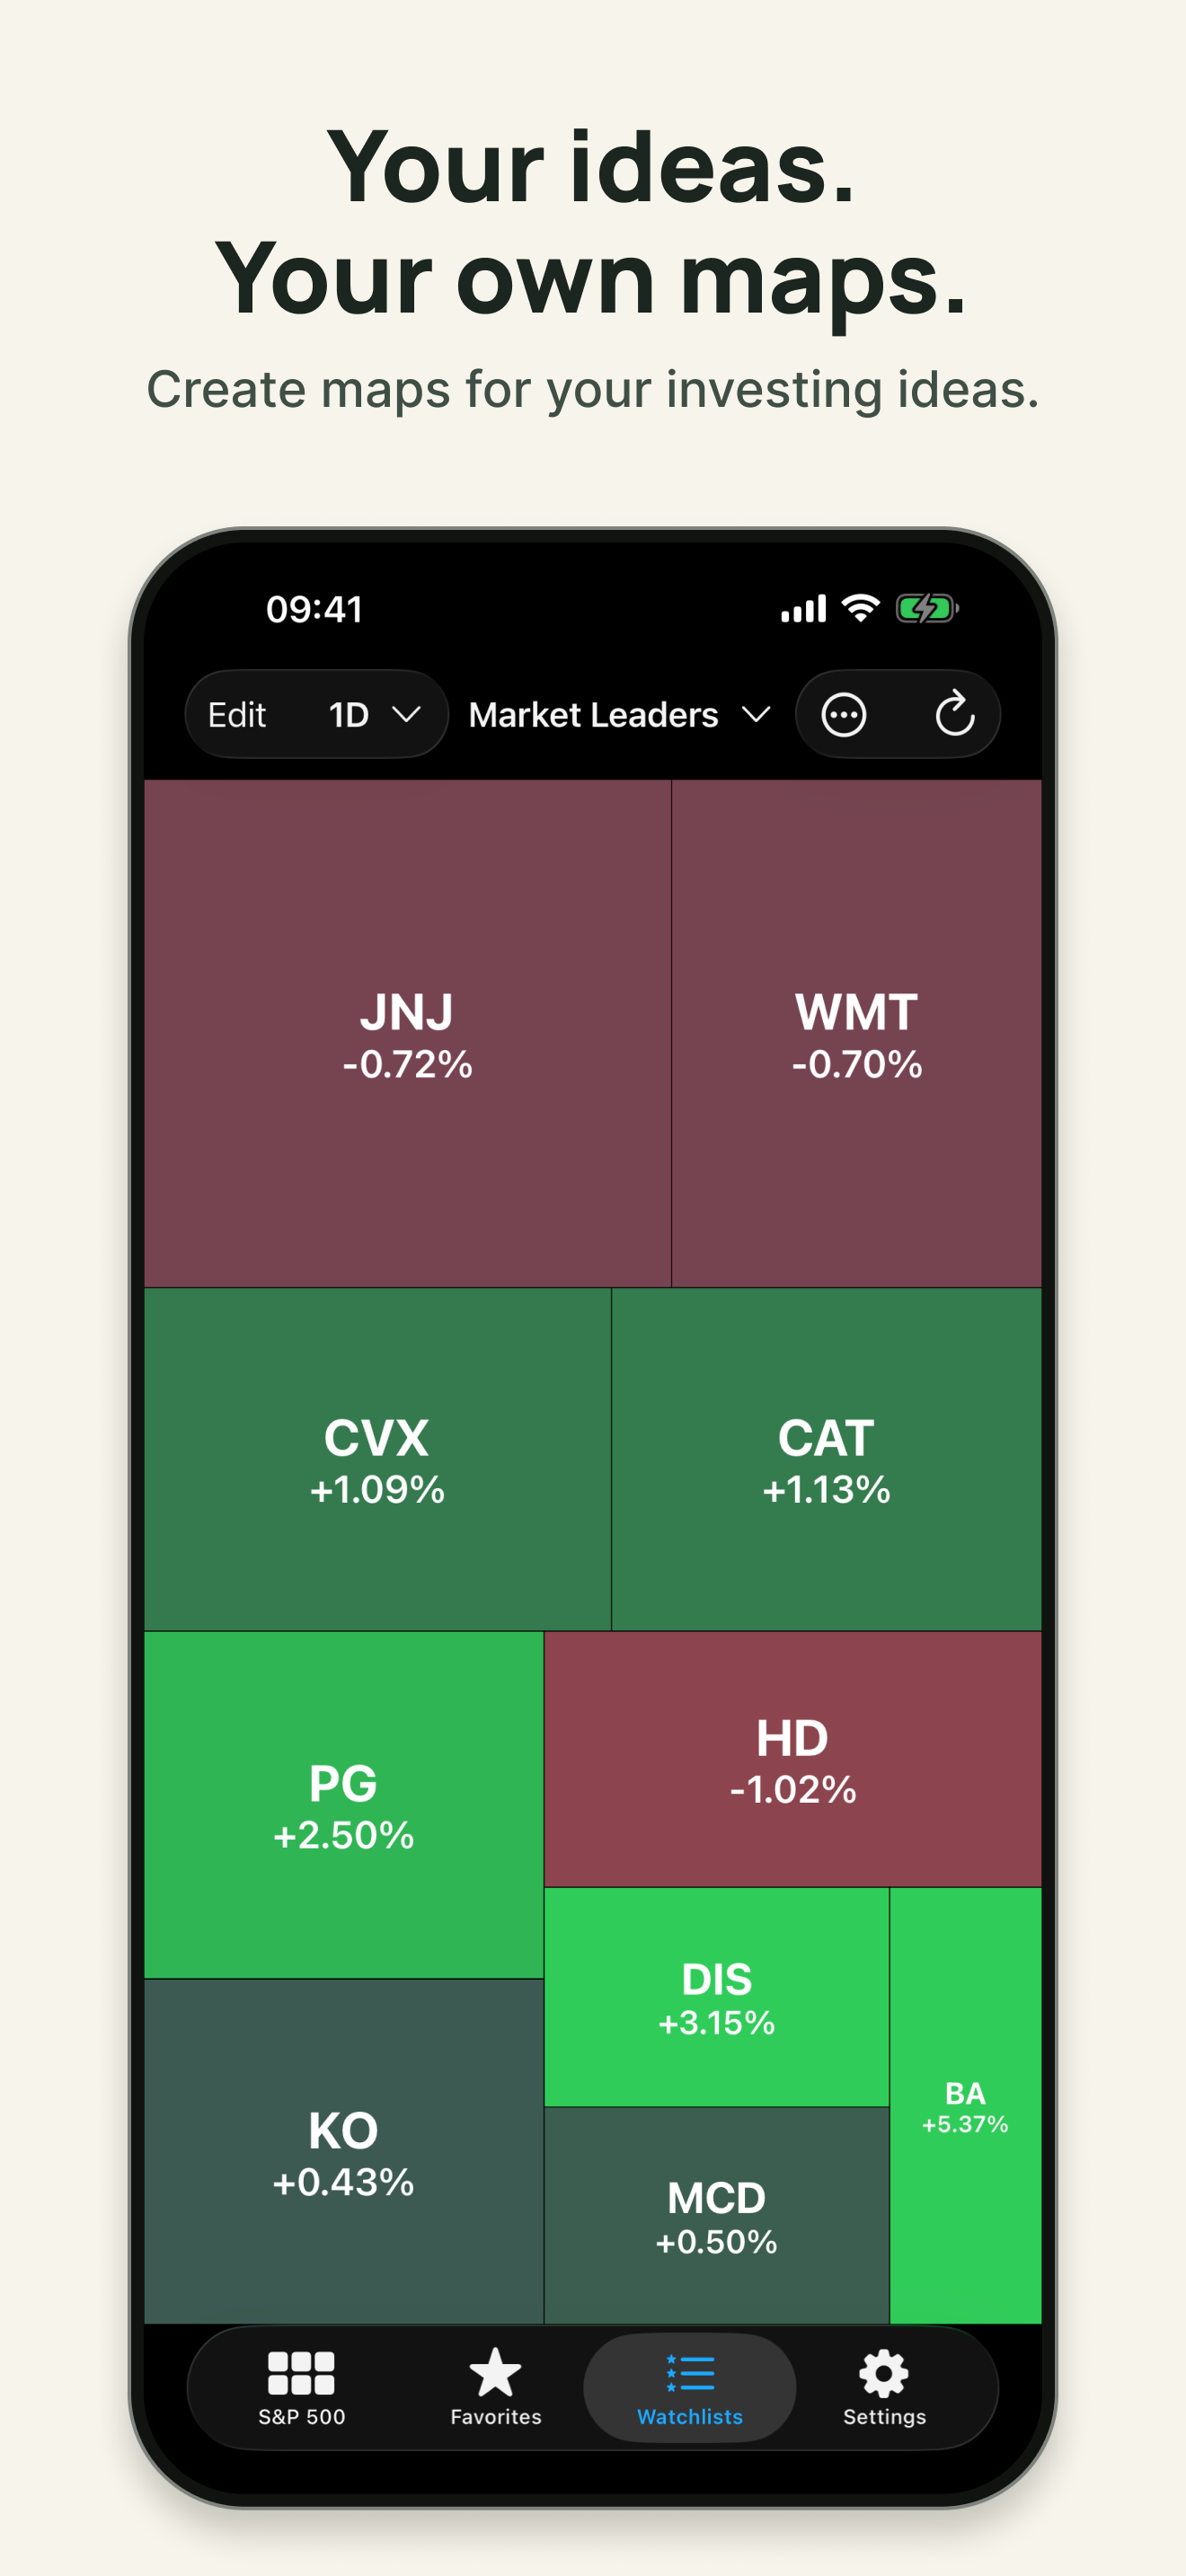
Screenshots

Stock Map: S&P 500 Heatmap screenshot 1Stock Map: S&P 500 Heatmap screenshot 2Stock Map: S&P 500 Heatmap screenshot 3Stock Map: S&P 500 Heatmap screenshot 4Stock Map: S&P 500 Heatmap screenshot 5Stock Map: S&P 500 Heatmap screenshot 6Stock Map: S&P 500 Heatmap screenshot 7Stock Map: S&P 500 Heatmap screenshot 8

03 / Market context

The business behind the app.

Keep revenue, downloads and store rankings separate from advertising performance.

How Much Does Stock Map: S&P 500 Heatmap Make?

Monthly Revenue
$1.0K
Annualized estimate
$12.0K
Per Download
$1.00

Platform Performance

🍎iOS
Revenue
$1.0K
Downloads
1.0K
Rating
4.8 ★(1,007)

Rating Distribution

4.8
★★★★★
1,007 reviews
5
1%
4
1%
3
3%
2
9%
1
86%

Top Countries

🇰🇷 KR🇹🇭 TH🇯🇵 JP
Reviews (3)▼
★★★★☆Pee Kay1/3/2024
First impressions... time scale not adjustable.

Nice to have a market overview heat map again since the last app I bought years ago went kaput. Promptly subscribed for a year. One thing I miss from the other app though is the ability to zoom to different time windows; I used that often to be able to get a longer duration sense of stock performance.

★★★★★Asteras.g12/24/2022
The best in class

Every person with a visual way of thinking about things will find this app the most fit for purpose.

★★★★☆TF2277711/3/2022
Paid for Additional Options and Nothing Happens

I paid for the option to change the heat map to equal weight instead of market cap and nothing happens. It will allow other features like names and/or symbols. Great heat map, but I wasted my money on options that didn’t work.

Version History (31)▼
1.309/7/2026
1.298/31/2026
1.289/16/2025
1.279/2/2025
1.264/21/2025
1.254/14/2025
1.2412/30/2024
1.238/20/2023
1.228/6/2023
1.2112/26/2022
Available In (115 Countries)▼
🇺🇸 United States🇦🇺 Australia🇨🇦 Canada🇨🇳 China🇫🇷 France🇩🇪 Germany🇬🇧 United Kingdom🇮🇹 Italy🇯🇵 Japan🇰🇷 South Korea🇷🇺 Russia🇩🇿 DZ🇦🇴 AO🇦🇷 Argentina🇦🇹 Austria🇦🇿 AZ🇧🇭 BH🇧🇧 BB🇧🇾 BY🇧🇪 Belgium🇧🇲 BM🇧🇷 Brazil🇧🇬 Bulgaria🇨🇱 Chile🇨🇴 Colombia🇨🇷 CR🇭🇷 Croatia🇨🇾 CY🇨🇿 Czech Republic🇩🇰 Denmark🇩🇴 DO🇪🇨 EC🇪🇬 Egypt🇸🇻 SV🇫🇮 Finland🇬🇭 GH🇬🇷 Greece🇬🇹 GT🇭🇰 Hong Kong🇭🇺 Hungary🇮🇳 India🇮🇩 Indonesia🇮🇪 Ireland🇮🇱 Israel🇰🇿 KZ🇰🇪 Kenya🇰🇼 KW🇱🇧 LB🇱🇹 Lithuania🇱🇺 LU🇲🇴 MO🇲🇬 MG🇲🇾 Malaysia🇲🇹 MT🇲🇽 Mexico🇳🇱 Netherlands🇳🇿 New Zealand🇳🇬 Nigeria🇳🇴 Norway🇴🇲 OM🇵🇰 Pakistan🇵🇦 PA🇵🇪 Peru🇵🇭 Philippines🇵🇱 Poland🇵🇹 Portugal🇶🇦 QA🇷🇴 Romania🇸🇦 Saudi Arabia🇷🇸 RS🇸🇬 Singapore🇸🇰 Slovakia🇸🇮 Slovenia🇿🇦 South Africa🇪🇸 Spain🇱🇰 LK🇸🇪 Sweden🇨🇭 Switzerland🇹🇼 Taiwan🇹🇭 Thailand🇹🇳 TN🇹🇷 Turkey🇺🇦 Ukraine🇦🇪 UAE🇺🇾 UY🇺🇿 UZ🇻🇪 VE🇻🇳 Vietnam🇧🇴 BO🇰🇭 KH🇪🇪 Estonia🇱🇻 Latvia🇳🇮 NI🇵🇾 PY🇦🇫 AF🇬🇪 GE🇮🇶 IQ🇱🇾 LY🇲🇦 MA🇲🇿 MZ🇲🇲 MM🇾🇪 YE🇧🇯 BJ🇧🇫 BF🇨🇲 CM🇨🇬 CG🇨🇮 CI🇯🇴 JO🇱🇦 LA🇲🇱 ML🇸🇳 SN🇹🇿 TZ🇺🇬 UG🇿🇲 ZM🇿🇼 ZW
Supported Languages (1)▼
English
App Details▼

See the market at a glance. Stock Map turns the S&P 500, Nasdaq 100, and Dow Jones into heat maps, with tiles sized by market cap and colored by stock...

iOS App ID
1594010760
Content Rating
4+
Min OS
15.0
Size
10.0 MB
In-App Purchases
Yes
Publisher
Nazim Can Altinova

In-App Purchases (2)

NamePriceType
Monthly Premium$3.99Monthly
Annual Premium$19.99Yearly