Check the acquisition promise
Read the store headline, screenshots and description. What problem is the app promising to solve?
Study the storefront ↗
Advisiant AS · iOS
Explore the ad evidence, study the storefront, and build your next acquisition hypothesis.
01 / Creative research
Read the store headline, screenshots and description. What problem is the app promising to solve?
Study the storefront ↗Explore apps with direct store-link matches. Compare their hooks and formats without assuming the same approach works here.
Browse observed advertisers ↗Store rankings and revenue estimates describe market context. They do not establish ad spend, conversions or ROAS.
Review the market context ↗02 / Storefront & product
Study the product story and store experience behind the acquisition funnel.





03 / Market context
Keep revenue, downloads and store rankings separate from advertising performance.
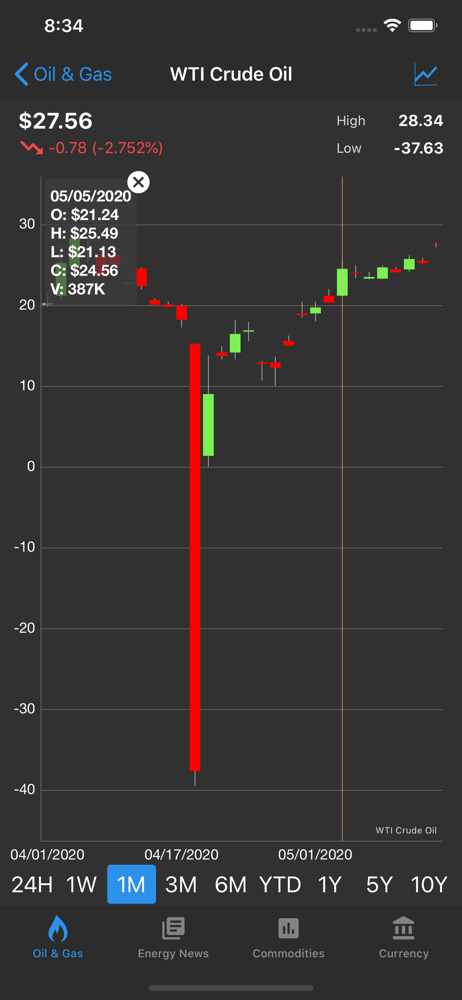
Nice, free, app that does the basics ok. But it could be a lot better if the charts were improved. The price scale is always divided in 5 steps, which leads to awkward intervals like 13 and 23. Look at the sample plot in the all description. Also, the time scale is weird: if set to one week, there should be 7 divisions. If set to 6 months, there should be 6 divisions. And so on. The time interval choices (only 5 — what’s this obsession with the number 5?) are too few: need to add options for 3 months, 1 year, even YTD. These improvements would make a huge difference. The candlestick charts are great but need to be available for less than 6 month charts. Notifications would be a great addition.
Performs exceptionally but there’s a few basic commodities that need to be added (diesel fuel, etc) to help procurement professionals track markets in real time. Maybe add a text notification option if specific markets move above/below specific set points?
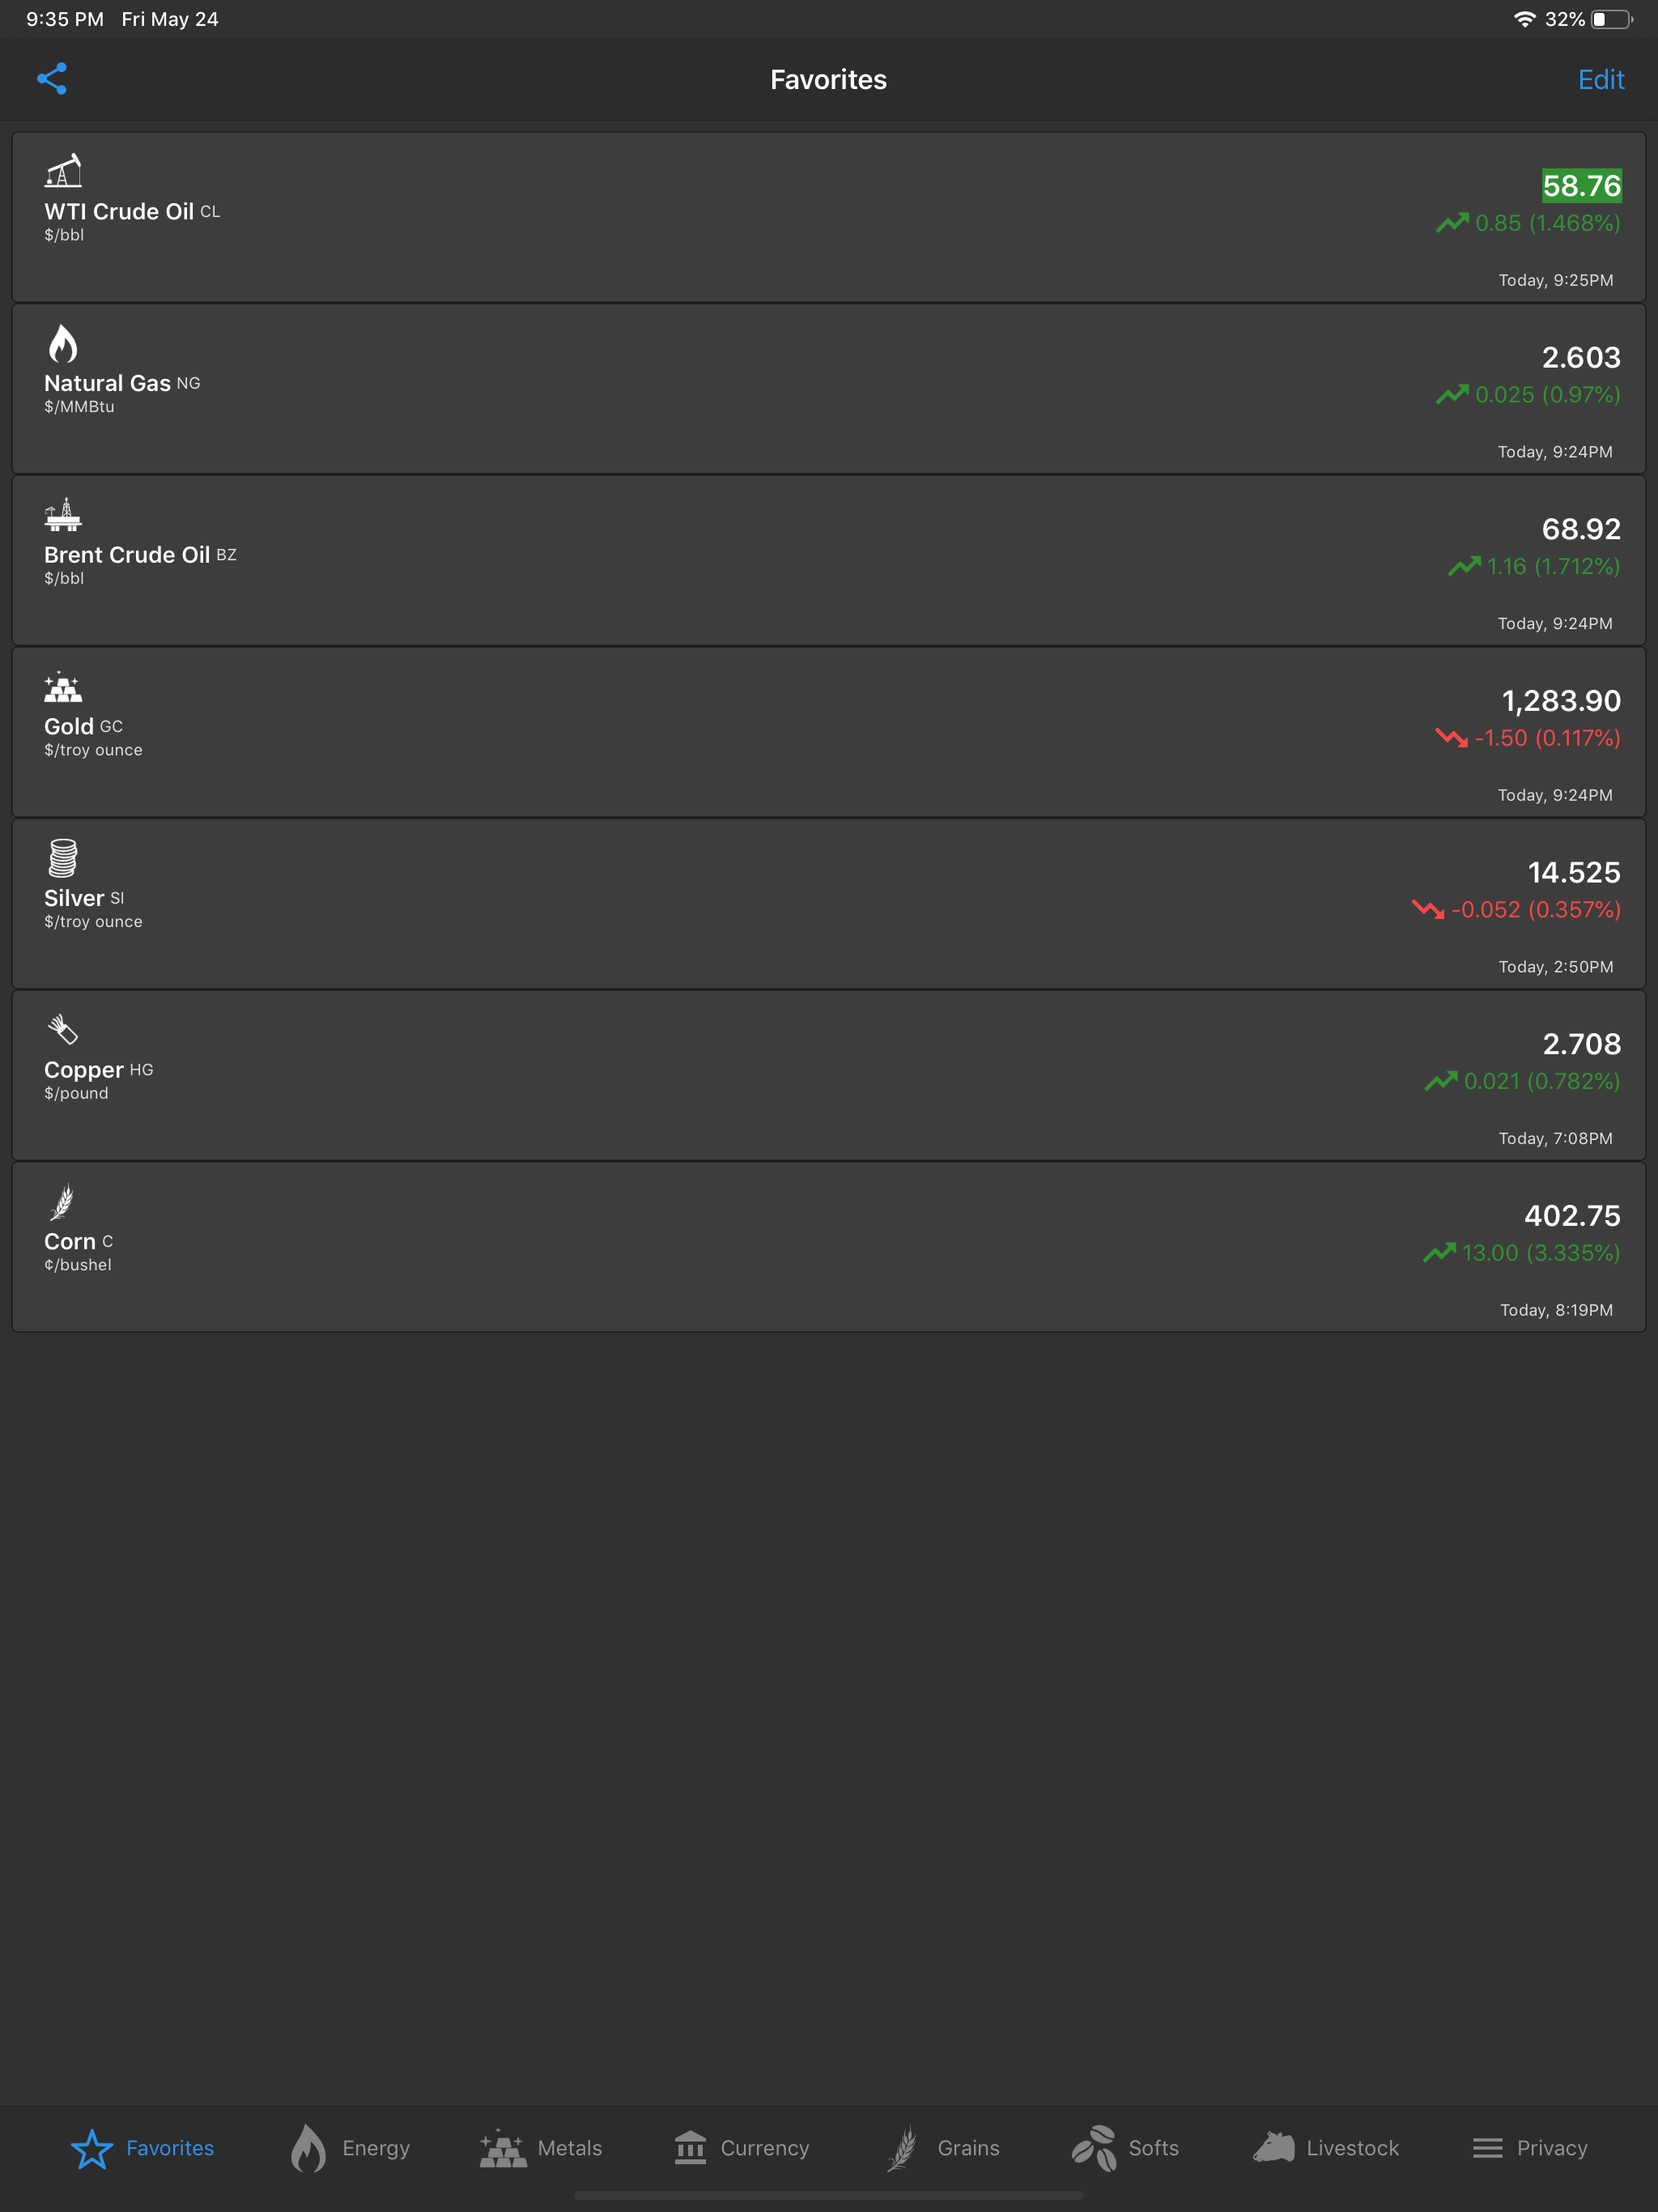
Exceptional app, I trade commodity ETFs and this is perfect for up to the minute prices on oil, nat gas, silver, and gold. There are many others this app tracks but those are the ones I use. Super simple layout, very straight forward and easy to navigate. This app has been a life saver and by far the best commodity app out there!!
Features: - Interactive Charts in portrait and landscape mode with zoom, range from: last 24 hours, 7 days, 1 months, 3 months 6 months, 1 year, 5 ye...
| Name | Price | Type |
|---|---|---|
| PRO (Annual) | $8.99 | Yearly |