
Check the acquisition promise
Read the store headline, screenshots and description. What problem is the app promising to solve?
Study the storefront ↗
Steffen Bauereiss · iOS
Explore the ad evidence, study the storefront, and build your next acquisition hypothesis.
01 / Creative research
Read the store headline, screenshots and description. What problem is the app promising to solve?
Study the storefront ↗Explore apps with direct store-link matches. Compare their hooks and formats without assuming the same approach works here.
Browse observed advertisers ↗Store rankings and revenue estimates describe market context. They do not establish ad spend, conversions or ROAS.
Review the market context ↗02 / Storefront & product
Study the product story and store experience behind the acquisition funnel.


03 / Market context
Keep revenue, downloads and store rankings separate from advertising performance.
I have been complaining about this for a year or so. On my iPad, I must be opening the app often, or as someone else said, I just see a straight line. It’s better on the iPhoneSE2020, but still a problem. Once in a while, I think it is fixed. I see lots of data points and a nice curve, but every time, it reverts back to the boxy lines within days. :( I don’t need to know either station pressure or sea level pressure right now. What I need are trends! And you can’t get accurate trends without enough data points, pure and simple. Is it better than nothing? Definitely. Could it be better? It sure seems so, because once in a while it is better! I am no programmer or app developer, but why does it become “fixed” now and then, only to revert back??? I am sticking with my 4-star rating because it still works, just not as well as I think it could/should. And I don’t know of anything better, which says something!
I bought this app not for the extra features but because I want to support developers who make good tools. The free version is better than what most paid apps claim to offer. Download and see for yourself. Some ideas for improvements: I’d like a widget that shows graphic changes. I use a barometer mostly to identify changes in weather that aren’t otherwise apparent (and when I cannot rely on the internet). Seeing a trend indicator for the last few hours without opening the app would be great. Also, alerts if the change is large enough. It would also be nice to have altitude as an alternative scale, so I can both gauge recent hiking and compare how my legs feel against the chart to detect atmospheric/weather changes while going up and down. Overall, great stuff. This is the sort of thing we used to pay $200 for in a watch.
Your joints-every single one of them is it’s own separate capsule- meaning it has its own pressure. I have patients who say they can tell when it’s going to rain or get cold. No, they can tell when the pressure’s dropping- which is almost always accompanied by some type of weather change, rain, cold or otherwise-and your joints internal pressure is “feeling” the External pressure change. High pressure is typically fair weather, a dropping barometer means change is coming-soon. Your astute assessment regarding your joints is correct-if someone tells you it’s a myth-they’re referring to your ability to discern rainy/cold weather-which is only partly true-I’m getting redundant. Most things in nature are in tune with the barometer- I notice I get hungry when the barometer drops-as does most of the animal kingdom, the fishing is typically better during a falling barometer. Alas, I’m a novice myself at setting the barometer-sorry I couldn’t be of more help there.
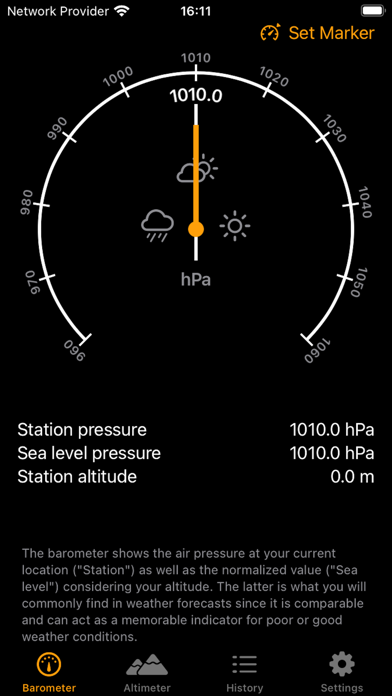
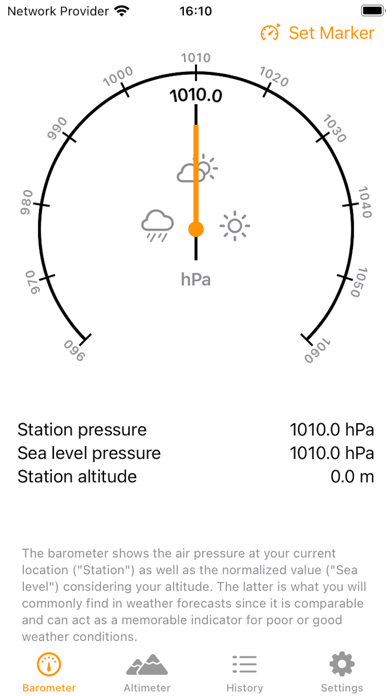
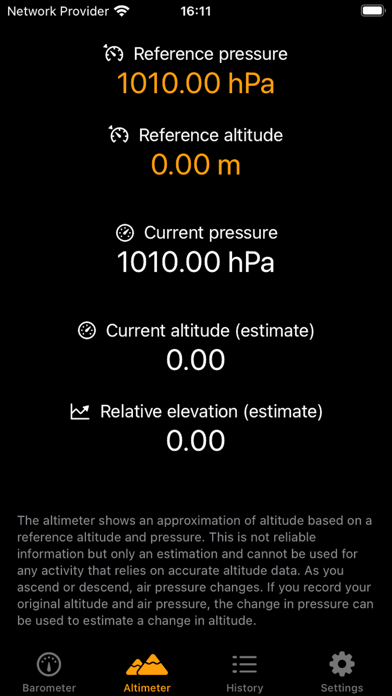
This app uses the barometric pressure sensor built into all newer iPhones and iPads and features a Barometer for weather, an Altimeter for outdoor act...


